Making Improvements That Last: An Illustrated Guide to DMAIC and the Lean Six Sigma Toolkit
MakingImprovements That Last An Illustrated Guide to DMAIC and the Lean Six Sigma Toolkit
Overview
Every organization has problems that get “solved” over and over again, only to reappear. Teams work hard for months, generating solutions that people just know will work… but don’t. This is another type of failure that Lean Six Sigma can’t afford. That’s why it uses a modern problem-solving method designed to avoid such problems. The model is called DMAIC (pronounced duh- MAY-ick), which stands for Define-Measure-Analyze-Improve- Control.
DMAIC has proven itself to be one of the most effective problem-solving methods ever used because it forces teams to use data to…
- Confirm the nature and extent of the problem
- Identify true causes of problems
- Find solutions that evidence shows are linked to the causes
- Establish procedures for maintaining the solutions even after the project is done
If you go through Lean Six Sigma training, you’ll learn a lot about DMAIC and its data-based methods that are called “problem-solving tools.” In this chapter of the book, we just want to introduce you to the logic of DMAIC and spotlight a few tools it uses to prevent the kinds of problems many teams used to run into. The next chapter will describe case studies where DMAIC was used to solve real problems.
Project chartering The transition into Define
Before we get into the DMAIC process itself, you should be aware of what happens before a team gets started. Your management team will likely go through a project selection process to identify the projects they want to launch. The Champion (the corporate-level executive leading the Lean Six Sigma effort) will help your supervisor or manager draft a project charter to document what they want the team to accomplish. The charter is usually short—just a 1- to 2-page form. Some companies find it helpful to use a form similar to that shown in Figure 8.1.
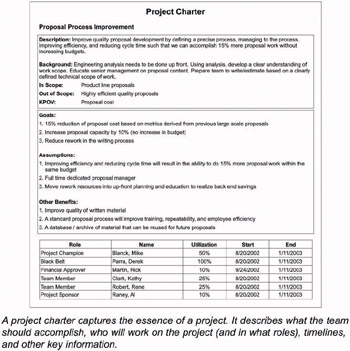
Figure 8.1: Sample Project Charter
What’s important to know is that the charter you’ll be handed if you serve on a team is just a draft. Your team will be expected to fine-tune it once you begin studying the problem in detail. In some cases, you may discover information that will make management re-think the decision to work on the project in the first place. Or the problem may be much bigger than they thought, and there’s no way the team can tackle it. (So the team will have to work with management to agree on what some reasonable goals are.)
Teams should refer back to their charters throughout their projects. For one thing, this helps remind them about what they are supposed to do. It also gives them a chance to update the charter as they learn more information about the problem and its likely solutions.
A quick tour of DMAIC
The Define-Measure-Analyze-Improve-Control (DMAIC) process is usually described as a “structured, data-based problem-solving process.” That means:
- Doing specific activities in a specific sequence (that’s the “structured” and “process” parts)
- Gathering data in nearly every phase to help you make decisions (the “data-based” part)
- Making sure that the solutions your team decides to use really will eliminate the cause of the problem you’re trying to fix (the “problem-solving” part)
DEFINE M A I C
The purpose of this first stage of the DMAIC process is for a team and its sponsors to agree on what the project is. The kinds of things you’ll do include…
- Discussing the project charter as a team.
- Getting customer data.
- Reviewing existing data about the process or problem.
- Drafting a high-level map of the process. (“Process maps” are one type of improvement tool used often in DMAIC. Here in Define, they are used to help establish the project boundaries.)
- Setting up a plan and guidelines for your team.
Why should you do these things? They help you…
- Develop a shared understanding of the business priorities for your project. (That word “shared” is key. Many teams get bogged down when people argue over what kind of data the team should collect or what solutions are best. That happens a lot when people don’t realize they have different ideas about what the team should be doing.)
- Confirm the opportunity. Talk to customers and look at any existing evidence to confirm that the problem that management wants you to solve is a real opportunity. This work will help you refine the project goals. In rare cases, a project may get canceled if the data does not support further work.
- Reach agreement with management on a realistic scope for the project. If your team thinks the project is too big (or too small), you need to negotiate with management to change the scope, add resources, and/or extend the deadline as appropriate.
- Agree on how “success” will be measured. A common mistake in the past was for teams and sponsors to NOT define up-front how they would know if the project is successful. A team would see the number of mistakes dropping, but what the manager wanted was an increase in sales. A team needs to know what its sponsor will be looking at to judge whether they are successful.
- Set the team up for success. Sometimes, a project team consists of people who work together every day. Other times, it brings together people from different departments who don’t know each other at all. The early work in Define will help team members get comfortable working together in an improvement setting.
Example Define tool #1 the SIPOC diagram (high level process map)
A core principle of Lean Six Sigma is that defects can relate to anything that makes a customer unhappy—long lead time, variation in lead time, poor quality, or high cost, for instance. To address any of these problems, the first step is to take a process view of how your company goes about satisfying a particular customer requirement. The tool for creating a high-level map of the process is called SIPOC, which stands for:
Suppliers: the individuals or groups who provide whatever is worked on in the process (information, forms, material)
Input: the information or material provided
Process: the steps used to do the work
Output: the product, service, or information being sent to the customer
Customers: the next step in the process, or the final (external) customers
An example of a SIPOC diagram is shown in Figure 8.2. A project team in a company that leased equipment was asked to reduce the number of errors in orders and corresponding invoices. As a first step, they created the SIPOC diagram to identify the basic elements of the process they were supposed to study.
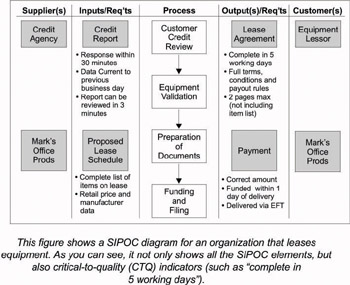
Figure 8.2: SIPOC process diagram
Example Define tool #2 Value Stream Map
SIPOC diagrams present a very simple view of a process, and are very useful for visually representing the basic elements of a process under study. But they don’t really help a team under- stand what needs to be changed in a process. For that, you need more detailed process maps (also called “flowcharts”).
One type of process map used frequently in Lean Six Sigma projects is called a value stream map. These maps not only show the process flow, but also display actual process data. (See example in Figure 8.3, top of next page). Because they include data, value stream maps can help teams pick out specific points in the process that have problems such as long wait times or lots of errors.
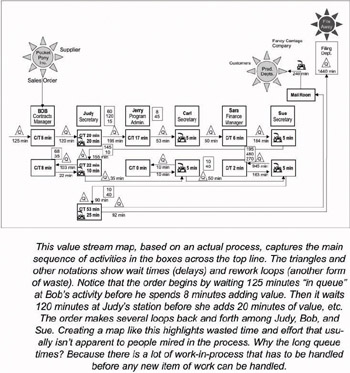
Figure 8.3: Value Stream Map
D MEASURE A I C
Measure is the heart of what makes Lean Six Sigma work when other approaches haven’t. If you don’t gather data, you’ll likely end up with a lot of quick-hit projects with short-lived or disappointing results. Combining data with knowledge and experience is what separates true improvement from just tinkering with a process. In Measure you will…
- Evaluate the existing measurement system
- Improving it if necessary
- Developing a measurement system if you don’t already have one
- Observe the process
- Gather data
- Map the process in more depth
Actions like these are necessary so you can…
- TRUST your data. You’d be surprised at how often a team spends a lot of time collecting data only to find out that their measurement system is unreliable. They discover that people were “starting the clock” at different points in the process when trying to measure cycle time. Or that people were reading an instrument gauge differently. Or had different definitions of what a “defect” was. If you’re going to be basing your decisions on data, you have to make sure you can trust what the data are telling you.
- Base decisions on facts and reality. We’ve said this several times in the book already: DMAIC is a data-based method. People’s opinions still count, but everything must be checked against what the data is telling you.
- Document what’s REALLY going on in the process. Kevin Fast, a Lean Six Sigma Black Belt and Manager of Quality Initiatives for Lifetime Support at Lockheed Martin in Moorestown, New Jersey, made an interesting observation: “When a project team comes together to define their process,” he remarked, “someone will say, ‘You do that? I didn’t know you did that!’ Or ‘You do this? I do this, too.’ It’s just amazing how people who have worked on a process for a long, long time often don’t realize everything that goes on.” Kevin was right. That’s why a Lean Six Sigma team has to document what is really going on.
- Understand what’s important to improve. Here’s a tip that will make your task as a “process improver” much easier. Of all the dozens or hundreds of actions you and your coworkers perform in your process, only a few of them make a real difference to your customer. Your job will be to find and improve those key tasks… then eliminate as much of the “non-value-adding” work as possible.
Example Measure tool #1 process observation
We’ve already talked about the need to document or “map” a process. But before you even get to that point, what you need to do is simply go out and watch what’s going on. In the famous words of Yogi Berra, “You can observe a lot just by watching.” There simply is no substitute for impartial observation as a way to confirm what really happens in a process and identify waste and inefficiencies that are built into how work is currently done.
Example Measure tool #2 time value map
A Time Value Map looks at how time is spent in a process. The chart consists of a timeline with bars broken out to highlight work that adds value in your customers’ eyes and work that doesn’t. One example is shown in the Figure 8.4 on the next page.
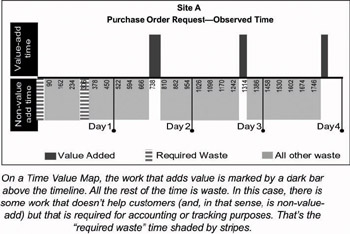
Figure 8.4: Time Value Map
Example Measure tool #3 Pareto charts
One of the reasons why many improvement efforts have failed in the past is that people make general changes targeted at general problems. What’s different in DMAIC is that you use data to pinpoint a specific cause of the problem. Then you develop solutions for that specific cause.
One of the most common tools used to help focus a team’s efforts is a type of bar chart called a Pareto chart (pronounced “puh-RAY-toe”—it’s named after an Italian economist). In a Pareto chart, each bar represents a different element of a problem. The height of the bar shows how much of the problem is due to that cause, and the bars are arranged in descending order (as shown in Figure 8.5, previous page). Almost always, the first few bars will be tall, and the rest will be much shorter. That means you can solve most of the problem if you take care of the issues represented by the tall bars—that is, focus your efforts on the few biggest causes.
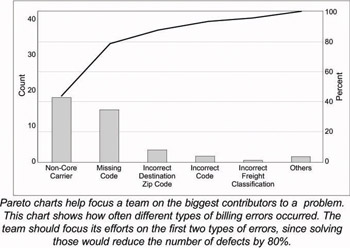
Figure 8.5: Pareto Chart
Example Measure tool #4 time series plots (also called run charts)
A time series plot is a chart where data points are plotted in sequence along a timeline (see Figure 8.6). Time plots are an important DMAIC tool for several reasons:
- They are very easy to construct. Once you learn a few basics, you can create one quickly with pencil and paper (useful even in this computer age!), or easily enter the needed data into a software program.
- They are easy to interpret. There are just a handful of rules you can apply that will help you understand what you see on the chart.
- The interpretation rules expose patterns that help you pinpoint when and where problems occur. They also help you understand the variation in a process, how things change from hour to hour, day to day, week to week.
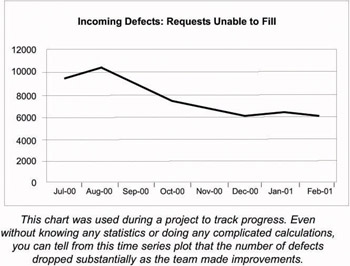
Figure 8.6: Time Series Plot
The challenges of data collection
If you’ve ever tried to gather data, you’ve probably encountered one or more of the following roadblocks:
- The data have never been collected before
- The data have been collected, but for all practical purposes are unavailable (lost in a file cabinet, stuck in an obscure software program, etc.)
- There is so much data that it’s difficult to figure out what has priority or what is most meaningful
- The data does not really measure what you think it measures
If any of these conditions hold true for your team, expect to spend a lot of time deciding what data to collect and finding a way to collect it.
D M ANALYZE I C
The purpose of the Analyze phase is to make sense of all the information and data collected in Measure, and to use that data to confirm the source of delays, waste, and poor quality. A challenge that all teams face in Analyze is sticking to the data, and not just using their own experience and opinions to reach conclusions about the root causes of problems. The things you’ll do include…
- Looking for patterns in the data
- Targeting places where there’s a lot of wasted time
These actions will allow you to…
- Find clues to the REAL causes
- Find ways to make the process faster without sacrificing quality
- Identify the most critical process factors to control
Example Analyze tool #1 cause and effect diagrams
A cause-and-effect diagram is a “thinking” tool that helps a team organize the ideas they have about potential causes of a problem. Organizing ideas this way serves two purposes:
- It helps a team make sure they haven’t overlooked potential causes
- It helps a team decide which causes to investigate further
A cause-and-effect diagram is sometimes called a fishbone because it resembles the skeleton of a fish. As you can see in the example on the next page (Figure 8.7), the team’s problem statement is named in the “head” of the fish, with potential causes arranged in sets of “bones” linked to the head. The smallest bones are the most specific types of causes that contribute to the next larger level of bone, and so on.
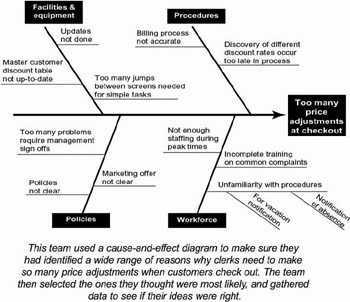
Figure 8.7: Example cause-and-effect diagram
Cause-and-effect diagrams do not tell you which of the potential causes is the culprit. They are just a good way for the team to document which theories it has considered, which have been targeted for further investigation, and, ultimately, which have been verified.
Example Analyze tool #2 scatter plots
The scatter plot is a simple tool that can help determine if a relationship exists between two measures or indicators. The example shown in Figure 8.8 (top of next page) was created to explore whether broker experience affected how long it took to complete client calls. The downward slope of the line shows that more- experienced brokers are able to complete calls more quickly.
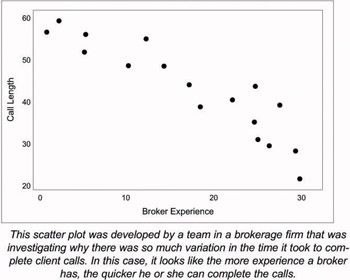
Figure 8.8: Scatter Plot
If customer satisfaction was high with the shorter calls, the team would then have to see what the experienced brokers knew that let them get done faster, and transfer that knowledge to less-experienced brokers.
Scatter plots provide a powerful visual image of how potential process factors are (or are not) related to a key outcome. Often, the visual impression is enough to confirm (or rule out) a specific course of action. If necessary, more advanced statistical tools can be used to quantify the degree of relationship between the two factors.
D M A IMPROVE C
The sole purpose of Improve is to make changes in a process that will eliminate the defects, waste, costs, etc., that are linked to the customer need identified in the Define stage. The links in the last sentence are critical. The team must make sure that the causes they’re looking at in Improve affect the problem or need defined in its charter. The changes they make must affect the causes they confirmed in Analyze. The things you’ll do include…
- Using creativity exercises to identify a range of possible solutions (rather than rely on things that are tried-and- true)
- Reviewing existing Best Practices (documented procedures known to produce good results) to see if any can be adapted to your situation
- Developing criteria for selecting solutions
- Piloting the chosen solution
- Planning for full-scale implementation
What does this get you? It will help your team…
- Not get stuck with the same old solutions that don’t work
- Develop new solutions that you KNOW are linked to the REAL causes
- Justify/explain why one solution was chosen over another
- Learn about what will and won’t work in reality
Example Improve tool #1 PICK chart (evaluating solution alternatives)
There comes a time in every project where the team has developed a number of alternative solutions they think could improve the problem. There are several ways that they can compare those alternatives. One of the simplest to construct is the PICK chart (Figure 8.9, top of next page). On this type of chart, your team just needs to identify how much effort it will take to implement your solution ideas, and what kind of payoff you expect. Performing this analysis helps you decide which ideas you should implement for sure, which may need more work, and which ones you should just abandon.
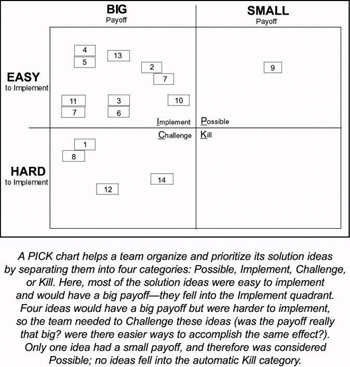
Figure 8.9: PICK Chart
Example Improve tool #2 Four Step Rapid Setup
A manager who wants to prepare a monthly report starts gathering together the information he needs. He realizes that this month’s sales figures aren’t broken out by region, so he calls over to accounting and tells them to email the regional split as quickly as they can. He also discovers that he has updates on only three of the four Lean Six Sigma projects in his unit. So he spends about 20 minutes tracking down a Black Belt and getting a verbal update on the fourth project. Then all he has to do is get the month’s wages/benefits figures from HR, and he’s ready to work on the report.
# # #
Dave, one of the more experienced technicians in IT knows more about PCs than nearly anyone else in the company. Trouble is, the graphic design group is on Macintoshes. So even though Dave spends 95% or more of his time supporting the PC users, he still has to answer a handful of calls each month from the Mac users. He describes the experience as having to “reconfigure” his brain so he can switch from thinking in Microsoft Windows to thinking in Apple’s OS X.
# # #
The people who work on the old machinery down in the steel plant dread the days when they have to process a number of different grades of steel. Changing steel grade means adjusting the machines. Minimally, they lose about a half hour each time they have a changeover. And that’s if everything goes right, which it doesn’t always. That’s why most of the time they produce a lot of one grade of steel at a time, even if no customers need it.
Odds are that at least one of these examples reflects what happens in your job—needing to track down information to finish a task, switching from one set of tasks to another, doing work in large “batches” because it seems easier, having some element of your job that you only rarely perform. Can you tell what they all have in common?
The answer is that all of these processes have problems that divert people away from their “value-add” work. If they could have the information at their fingertips, if it was easier to switch from one computer system or grade of steel to another, these people could get a lot more work done. Problems like these slow down a process.
In Lean terminology, the situations described above are all considered setup problems that delay or interrupt people as they try to complete the “value-add work.” The Lean tool for attacking setup time is the Four-Step Rapid Setup method. The actual procedures are too detailed to go into in this book. Very briefly, the four steps cover techniques like doing prep work in parallel with value-add work, eliminating the need for set up work, and so on. In short, the principle of this method is to eliminate anything that interrupts or hinders productivity.
Here’s an example from a service situation (the principles hold true for manufacturing as well). The buyers in one division of Lockheed Martin had to purchase parts for 14 different business units—each of which had its own computer system. To process the purchase orders, a buyer would log onto one unit’s system, work through all of its purchase requests, log off that system and onto another unit’s system, and so on. Switching from one system to another could take the buyers as much as 20 minutes at a time—which is why they would do all the orders from one unit before going on to the next.
Because of the large number of purchase requests, it could take a buyer a full day to complete the orders for one unit. With 14 units, that meant each unit’s orders would be handled only once every three weeks! Is it any wonder that the units complained about how long it took them to receive the materials they wanted?
The Four Step Rapid Setup method challenges people to think about work like “switching computer systems” in new ways. Can it be eliminated? If not, what can be done to make it simpler and shorter?
In this case, the answer was that yes, it could be eliminated. The team worked with the technology department to develop a system where all the orders from all the sites were automatically downloaded into a central database every day. So the buyers just had to log into one database to see all the orders from all the units. They could also tell which requests were high priority and process those first.
Most likely you won’t have heard of the Four Step Rapid Setup method before. So why did we take so much time talking about it? For two reasons: At a general level, we wanted to show that the Lean Six Sigma toolkit includes tools that help you develop solutions as well as tools for gathering and understanding data. More specifically, the Four Step method is often THE critical tool for accelerating process speed. In the Lockheed Martin example discussed above, for example, the average time it took for buyers to enter orders went from 14 or more days on average to 1 or 2 days.
D M A I CONTROL
The purpose of Control is to make sure that any gains your team makes will last. That means creating procedures and work aids that will help people do their jobs differently from now on. The team must transfer what they learned to the process owner and ensure that everyone working on the process is trained in using the new, documented procedures. In Control you will…
- Document the new, improved procedures
- Train everyone
- Set up procedures for tracking key “vital signs”
- Hand-off ongoing management to the process owner
- Complete the project documentation
The actions will help you…
- Prevent backsliding. Changing habits is a lot harder than changing the switches on a machine. The actions listed above will make it easier for people to use the new procedures and NOT slip back into the old way of doing things.
- React quickly to future problems. Tracking the vital signs for your process will help you respond quickly when and if new problems appear. The sooner you react, the more likely you are to be able to find the cause and put a new solution in place.
- Share the learning with others in your organization. Chances are there are other people in your organization doing the same kind of work that you do, or at least something very similar. Having your team’s work documented in a simple way will help other people share the learning and insights from your team.
Example Control tool #1 control charts
Probably the most common tool in Control is a control chart, which you can think of as a super-charged time series plot. Like a time plot, the data points are plotted in time order. But control charts have additional lines on them (control limits) that are used for interpreting patterns in the data. (See example in Figure 8.10.) Basically, if any points go outside the control limits, that’s a signal of unusual variation. Someone should investigate what’s going on in the process right away. (In addition, specific patterns of points within the limits are also used as signals.)
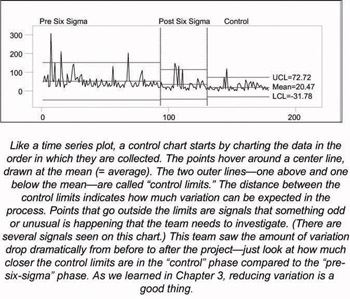
Figure 8.10: Control Chart
Control charts look complicated, but they are fairly easy to construct based on some simple mathematical formulas. Team members will often get help from a Black Belt and/or statistical software for constructing these charts.
Conclusion
It takes discipline to find real solutions to problems. The DMAIC framework provides that discipline and structure to teams. It can sometimes seem tedious to work through all the steps of Measure and Analyze—gathering data, learning lessons, realizing you have to gather even more data. Perhaps the biggest challenge you’ll face is the temptation to skip all the messy stuff in the middle and go right from defining the problem to implementing solutions.
If you work on a DMAIC project, we promise that you’ll have periods where you think it isn’t worth it. When that happens, keep in mind that DMAIC wasn’t developed by people who had nothing better to do with their time. It’s the result of years of experience from people who’ve learned the hard way what it takes to make improvements that last.
EAN: 2147483647
Pages: 64
