The Script Debugger
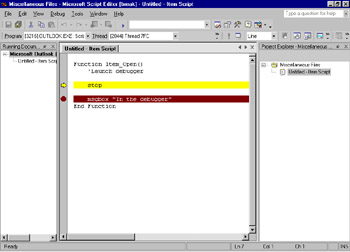
Using the Microsoft Script Debugger, shown in Figure 5-2, you can debug the VBScript code you add to an Outlook application.

Figure 5-2: The Microsoft Script Debugger
To use the Script Debugger, you must first install it. It's best to get the latest version from http://msdn.microsoft.com/scripting/ . The Script Debugger is also installed as part of Microsoft Office. If you do not already have the debugger, Office will automatically install it when you attempt to use it from Outlook.
You can launch the Script Debugger in three ways. The first way is to insert a Stop statement in your VBScript. When you run your form and the Stop statement is executed, the Script Debugger should automatically be launched. The second way is to launch it manually from a form that contains VBScript and is in run mode by choosing Forms, Script Debugger from the Tools menu. The final way is to enable JIT debugging; when you hit an error, the debugger is automatically launched.
Here are some common tasks you can perform with the Script Debugger:
-
Set a breakpoint To set a breakpoint, insert a Stop statement in your VBScript code. When the Stop statement is encountered , the Script Debugger is launched automatically.
-
Control script execution Once you're working with the Script Debugger, you can control the execution of the script. You can either step through a procedure line by line or step over procedures to have it run without having to step line by line. You can also cause the script to continue executing normally after it has been stopped .
-
View and change values at run time Using the Command window of the Script Debugger, you can view and change the values for specific variables in your application. These changes are preserved only in the context of the current script. For example, you can print to the Command window the value of a variable ”such as the Subject property of the current item ”by using the Item.Subject command. You can also change the value by typing an assignment statement such as Item.Subject = My Debugged Script . You can execute methods inside your script by calling them directly.
-
Trace the call stack The Script Debugger includes all the currently running procedures in your script. This allows you to see how a particular procedure was called, which is especially helpful when that procedure is a part of a group of nested procedure calls. (You can view the source of your script in the Script Debugger, but it's read-only; to make changes to your script, you must go back to the Outlook Script Editor.)
EAN: 2147483647
Pages: 227