Debugging Other Windows Forms Applications
There are several types of Windows Forms applications, most of which are perfectly straightforward to debug. The following section describes some aspects of the debugging process that may not be completely straightforward.
Debugging a Class Library
Although debugging class libraries is very similar to normal Windows Forms debugging, there are a few subtleties that are worth noting. In this debugging session, the class library is automatically loaded by the application, but it's common to have situations where you're debugging a solution that contains a class library but doesn't contain an application to launch it. In this case, you need to go to the project's Properties ’ Configuration Properties ’ Debugging page, as shown in Figure 7-5.
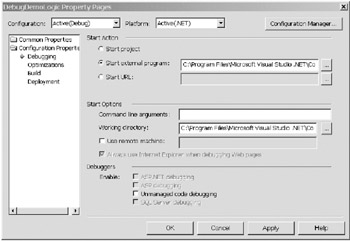
Figure 7-5: The project start options page
On this page, you have the option to start the debugging of your project by using an external program or a URL. You can specify a prebuilt component that will launch your class library by using the "Start external program" option. If your class library is invoked from a Web site, you can specify the URL by using the "Start URL" option. Finally, you should use the "Wait for an external process to connect" option when your class library is part of a Web application or a Web service ”the debugger will then attach to any process that calls into your project.
Occasionally, you can find that there are multiple copies of your class library spread around your hard disk, and your solution doesn't load the one that you were expecting. If the class library was installed into the global assembly cache (GAC) so that it could be shared with other applications, this can take precedence of any local copy, which can be confusing. To verify the load path of your class library, go to the Modules window and check the Path column of the module. This will tell you which location was used to load the class library.
Multiple copies of a class library can also cause the debugger to become confused about which debug symbols to use, and it can sometimes lead to no debug symbols being loaded for the class library. This in turn means that none of your class library's breakpoints will be hit. You can use the Modules window to check whether debug symbols were loaded for the library. Look at the Information column. If it shows that no symbols were loaded for the module, you can right-click the module and select "Reload symbols" to specify where the correct debug symbol file can be found.
Sometimes your application crashes in an unknown class library or in a system DLL. If all that you know is a crash address, you can rerun your application and go to the ever-helpful Modules window. If you sort the module list using the Address column, you can find the module that instigated the crash by finding the class library whose address range contains the crash location.
A final point is that if the application that uses your class library was written using unmanaged code, you need to go to the project's Properties ’ Configuration Properties ’ Debugging page and select the "Unmanaged code debugging" option.
Debugging a Windows Forms Control
To debug a Windows Forms control where you have access to the source, you normally have to add that control's project to the solution that uses the control. If you don't want to import the whole control project, you can instead add just the control's source modules in which you're interested.
To illustrate this, I created a new Windows Forms control that inherits and extends the standard TextBox control to permit the entry of positive integers only. To try this control, load the DebugDemo solution discussed previously and go to the Tools ’ Customize Toolbox menu item. Click the .NET Framework Components tab. Then click the Browse button and navigate to the \DebugDemoControl\bin folder. Here you can add the DebugDemoControl.dll control to the Toolbox so that you're able to start using the control. The NumericTextBox control should now appear in the General tab of the Toolbox.
After you bring the DemoForm form to the front in the IDE Source window, drag the NumericTextBox control from the Toolbox and drop it on the form. If you run the solution and try to type text into this customized text box, you'll find that you can only type numbers into the control ”all other keys are suppressed.
Assuming that you wanted to debug this control, you don't need to add the control's entire project. Instead, go to the File ’ Add Existing Item menu item and navigate to the \DebugDemoControl folder. Double-click the NumericTextBox.vb file, which will add the source code for the control to your solution. With the source code for the control displayed in the Source window, you can set a breakpoint for the control that will be hit as normal. When you've finished debugging the control, right-click the newly added file in Solution Explorer and select the Remove menu item. This is a quick and nonintrusive way of debugging external class libraries and controls that are used by your solutions.
It's worthwhile to examine the source of the NumericTextBox custom control because it demonstrates a debugging idea that's useful to both the control authors and the users of their controls. If you look at the control's source code shown in Listing 7-1, you can see that it defines and raises control debug events. These events supply debugging information to a user of a control when that user has no access to the control's source code. If the developer changes the control's DebugMode property to true , the control raises a debug event every time it does something that might be of interest in debugging. The control's user can trap these events to get a better understanding of the control's behavior and to gather debugging information that can be communicated to the control's author.
| |
Option Strict On Imports System.Windows.Forms Public Class NumericTextBox : Inherits TextBox Private m_DebugMode As Boolean = False 'This public property allows the control's user 'to see debug events raised by the control Public Property DebugMode() As Boolean Get DebugMode = m_DebugMode End Get Set(ByVal Value As Boolean) m_DebugMode = Value End Set End Property Private Sub NumericTextBox_KeyPress(ByVal sender As Object, _ ByVal e As System.Windows.Forms.KeyPressEventArgs) _ Handles MyBase.KeyPress 'Suppress any non-numeric keys If e.KeyChar < "0"c Or e.KeyChar > "9"c Then e.Handled = True ShowDebugMessage("Suppressed character: " & e.KeyChar.ToString) End If End Sub Private Sub ShowDebugMessage(ByVal DebugComment As String) 'Raise debug event if user wants to see debug events If m_DebugMode = True Then Dim CallingMethod As New System.Diagnostics.StackFrame(1) RaiseEvent DebugMessage(CallingMethod.GetMethod.Name, _ DebugComment) End If End Sub Public Event DebugMessage(ByVal DebugMethod As String, _ ByVal DebugComment As String) End Class | |
As you can see, the control's DebugMode property is set to false by default, but it can be set to true if the control's user wants to see the debug events. The KeyPress event supplies a debugging comment, in this case a remark showing the non-numeric character that was suppressed. The ShowDebugMessage procedure decides whether to raise the debug event depending on the setting of the DebugMode property and also adds the name of the procedure that produced the debug comment. Finally, it raises the DebugMessage event to the control's container.
Now you can look at these control debug events from the viewpoint of the control's user. Listing 7-2 shows some code that might be written in the control's container, in this case a standard Windows form.
| |
Option Strict On Public Class ControlContainer : Inherits System.Windows.Forms.Form Private Sub ControlContainer (ByVal sender As System.Object, _ ByVal e As System.EventArgs) _ Handles MyBase.Load 'Switch on control debugging CustomControl.DebugMode = True End Sub Private Sub ShowDebugMessage(ByVal DebugMethod As String, _ ByVal DebugComment As String) _ Handles CustomControl.DebugMessage 'Show the debug message MsgBox(DebugComment, _ MsgBoxStyle.OKOnly Or MsgBoxStyle.Information, _ DebugMethod) End Sub End Class
| |
In the Form_Load event, the control's DebugMode property is set to true so that the control's debug events can be monitored . Then, in this example, every debug message raised by the control is displayed in a message box. In reality, all of this debugging information would more likely be written to a trace listener, a log file, or some other form of logging. This is a valuable debugging aid because it enables the control's user to monitor and understand the control's behavior and, if necessary, report any problems to the control's author with some evidence to confirm the problem report.
Debugging a Visual Studio Add-In
Debugging a Visual Studio add-in is slightly different from debugging most other application types. To show this, I created an add-in called DebugAddIn , represented by the solution that you can find in the \DebugAddIn folder. This simple add-in merely pops up a message box, but it's functional enough to demonstrate add-in debugging.
Once you've loaded the solution into Visual Studio, put a breakpoint on line 67, where the message box is displayed. Then check the DebugAddIn project's Properties ’ Configuration Properties ’ Debugging property page, where you can see that the wizard that created this add-in specified that the project should be started using the external program devenv.exe, which is the Visual Studio executable.
So when you press F5 to start executing the add-in, you'll find that a new instance of Visual Studio will start. If you go to the Tools menu of this new instance, you can see that the add-in shows itself with a cheery little emoticon. When you actually run the add-in, the breakpoint that you created on line 67 in the first Visual Studio instance will be hit. What's happening is that the debugger in the first instance of Visual Studio has started and then attached itself to the second Visual Studio instance.
You can now debug as normal, but when you've finished debugging you should always close the add-in and the second Visual Studio instance before closing the first instance.
Debugging a Control Designer
Debugging a control designer is very similar to debugging a Visual Studio add-in. You add your control onto a form and then load your control designer solution into a second instance of Visual Studio. In this second instance, go to the Debug ’ Processes menu item and attach the debugger to the first instance of Visual Studio. This will show as a process in the Processes window called devenv.exe. Then just add breakpoints to your designer code and start manipulating the control in the first instance of Visual Studio. Your breakpoints will then be hit normally.
EAN: 2147483647
Pages: 160