CASE 2: SCHIZOPHRENIA RESEARCH - CAUSALITY IN COMPLEX SYSTEMS
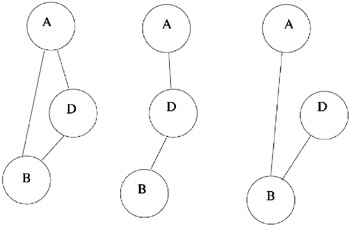
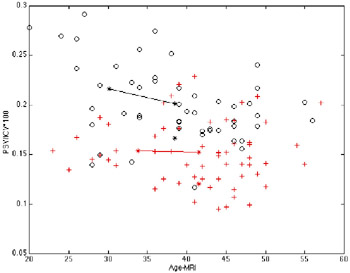
CASE 2: SCHIZOPHRENIA RESEARCH CAUSALITY IN COMPLEX SYSTEMSThis application is directed at understanding a complex system the human brain (Hall, Larsson, & Sedvall 1999). Similar methods have been applied to understanding complex engineered systems like paper mills, and economic systems. Many investigations on normal subjects have brought immense new knowledge about the normal function of the human brain, but mental disorders still escape understanding of their causes and cures (despite a large number of theories, it is not known why mental disorders develop except in special cases, and it is not known which physiological and/or psychological processes cause them). In order to get handles on the complex relationships between psychology, psychiatry, and physiology of the human brain, a data base is being built with many different types of variables measured for a large population of schizophrenia patients and control subjects. For each volunteering subject, a large number of variables are obtained or measured, like age, gender, age of admission to psychiatric care; volumes of gray and white matter and cerebrospinal fluid in several regions of the brain (obtained from MR images), genetic characterization, and measurements of concentrations in the blood of large numbers of substances and metabolites. For the affected subjects, a detailed clinical characterization is recorded. In this application, one can easily get lost. There is an enormous amount of relatively unorganized knowledge in the medical profession on the relationships and possible significances of these many variables. At the same time, the data collection process is costly, so the total number of subjects is very small compared, for example, with national registers that have millions of persons but relatively few variables for each of them. This means that statistical significance problems become important. A test set of 144 subjects, 83 controls, and 61 affected by schizophrenia was obtained. This set was investigated with most methods described in this chapter, giving an understanding of the strongest relationships (graphical model), possible classifications into different types of the disease, etc. In order to find possible causal chains, we tried to find variables and variable pairs with a significant difference in co-variation with the disease, i.e., variables and tuples of variables whose joint distribution is significantly different for affected person relative to control subjects. This exercise exhibited a very large number of such variables and tuples, many of which were known before, others not. All these associations point to possible mechanisms involved in the disease, which seems to permeate every part of the organism. Using the methods finding directions of arrows in directed graphical models, it turns out that in several cases independent variables like subject's genotype or age come out as caused by variables that are dependent, like blood tests or brain region sizes. This shows that application of causality methods give misleading results in a case like this, where it is known that many important variables cannot be measured, and are even not known. Thus it is not generally possible to see which is the effect and what is the cause, and many of the effects can be related to the strong medication given to all schizophrenic patients. In order to single out the more promising effects, an undirected graphical model approach was tried: Each variable was standardized around its mean, separately for affected and controls, and discretized. Then the pairs of variables were detected giving the highest probability to the left graph in Figure 4. Here D stands for the diagnosis (classification of the subject as affected or control), and A and B are the two variables compared. In the next graph, the relationship can be described as affecting the two variables independently, whereas in the next model where variables A and D are swapped, the relationship can be described as the disease affecting one of them but with a relationship to the other that is the same for affected and for controls. Many of the pairs selecting the first graph involved some parts of the vermis (a part of cerebellum). Particularly important was the subject age and posterior superior vermis volume pair. As shown in Figure 5, this part of the brain decreases in size with age for normal subjects. But for the affected persons the size is smaller and does not change with age. Neither does the size depend significantly on the duration of the disease or the medication received. Although these findings could be explained by confounding effects, the more likely explanation presently is that the size reduction occured before outbreak of the disease and that processes leading to the disease involve disturbing the development of this part of the brain. Several other variables were linked to the vermis in the same way; there was an association for control subjects but not for the affected ones, indicating that the normal co-variation is broken by the mechanisms of the disease. For variables that were similarly co-varying with the vermis for controls and affected, there is a possibility that these regions are also affected by the disease similarly to the vermis.
| |||||||||||||||||||||||||||||||||
| | |||||||||||||||||||||||||||||||||

EAN: 2147483647
Pages: 194