RESULTS
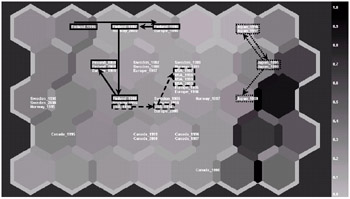
Country AveragesThe first benchmarking objects were the averages for each country or region included in the experiment. The regional averages consist of the average values of the ratios of all companies from that region. By benchmarking the national or regional averages first, it is possible to isolate differences due to accounting practices or other differences that affect all companies from a given country. The results are presented in Figure 5. The arrows indicate movements from year to year, starting from 1995. The Finnish average's movements are shown using solid lines, U.S. average's movements using dashed lines, and Japanese average's movements using dotted lines. The figure illustrates that the performance of Finnish companies, on average, has been slightly above average. The Finnish average has remained in Group C throughout the experiment, except for during 1995, when it was within Group A2. This implies that while Return on Equity has been high, other profitability ratios have been average. This is probably due to the common Finnish practice of heavy financing by debt. Where Return on Total Assets is considered, Finnish performance is merely average. Finnish Quick Ratios, on the other hand, are very good throughout, and excellent during 1998 2000.
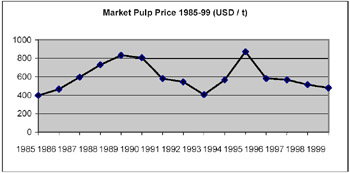
The excellent performance of the Scandinavian countries during 1995 is very interesting. During 1995, Finnish, Swedish, and Norwegian companies, on average, outperformed all other companies, except for Canadian companies. However, the following years indicate drastically reduced profitability. A likely explanation for this trend is the fall in market pulp prices during the later half of the 1990s. In 1995, market pulp prices were very high (USD 871 / metric ton), but fell drastically during the following years to USD 480 / metric ton in mid 1999 (Keaton, 1999). Pulp prices are illustrated in Figure 6.
The poorest average is displayed by Japan. The Japanese average is consistently in one of the two poor groups, Group D or E. The drop during 1997 is likely due to the Asian financial crisis. Interestingly, the Asian financial crisis does not seem to affect other countries as badly as might be expected. The national averages of Sweden, Norway, and the U.S. do drop somewhat, but not nearly as dramatically or obviously as the Japanese average. Another factor that might affect the Japanese average is prevailing accounting laws. Japanese accounting laws are very restrictive, compared to, for example, U.S. accounting laws. For example, Japanese companies value assets at historical costs, never at valuation. They are also forced to establish non-distributable legal reserves, and most costs must be capitalized directly. Also, with accounting statements being used to calculate taxation, there is an incentive to minimize profits. Overall, Japanese accounting principles can be seen as very conservative, and so might lead to understated asset and profit figures, especially when compared to U.S. or other Anglo-Saxon figures. These factors might partly explain the poor performance of the Japanese companies in this experiment (Nobes & Parker, 1991). Sweden, Norway, Europe, and the U.S. exhibit rather similar behavior, only really differing during the year 1995, when Finnish, Swedish, and Norwegian performance was excellent (Group A2). During most years, these countries show low to average profitability and average solvency. The companies in question are usually found in Groups C or D. Canadian companies consistently show better solvency than most companies from the other countries, being found in Group B during most years. Scandinavian accounting laws can also be seen as rather conservative, compared to Anglo-Saxon laws. Scandinavian companies also value assets at historical costs, but are, on the other hand, not forced to establish non-distributable legal reserves. The widely differing results of the Finnish, Canadian, and Japanese companies indicate that national differences, such as financing practices or accounting differences, might have an effect on the overall positioning of companies on the map. On the other hand, the financial ratios have been chosen based on their reliability in international comparisons, in order to minimize differences relating to accounting practices.
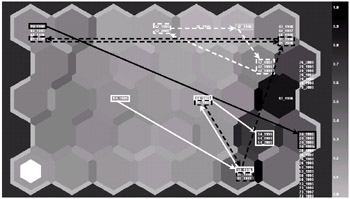
The Five Largest Pulp and Paper CompaniesIn Figure 7, the Top Five pulp and paper manufacturing companies (Rhiannon et al., 2001) are benchmarked against each other. Again, the movements from year to year are illustrated with arrows: solid black lines for International Paper, dashed black lines for Georgia-Pacific, solid white lines for Stora Enso, dotted white lines for Oji Paper, and dashed white lines for Smurfit-Stone Container Corp. As was mentioned earlier, Proctor & Gamble and Nippon Unipac Holding could not be included in this study, and therefore, Smurfit-Stone Container Corp. rose into the Top Five instead.
An interesting note is that, with the exception of 1995, International Paper, the largest pulp and paper manufacturer in the world, is consistently found in one of the poorly performing groups, showing poor performance during most years, particularly according to profitability ratios. Georgia-Pacific (GP), the second largest in the world, rose into the Top Five through its acquisition of Fort James in 2000. With exception of 1995 and 1999, GP's performance is not very convincing. Profitability is average to poor, and solidity is average. It is, however, interesting to note that the performance of Georgia-Pacific is very similar to that of Stora Enso during the years 1995 1997. Stora Enso (fourth largest) moves from very good in 1995 to downright poor performance in 1997. The substantial change in position on the map in 1998 was due to a combination of two factors. The first was decreased profitability due to costs associated with the merger of Stora and Enso. The second factor was a strengthened capital structure, which of course further affected profitability ratios like ROE and ROTA. However, profitability improved again in 1999. Stora Enso was performing excellently in 1995, when pulp prices were high, but profitability fell as market pulp prices dropped. In 2000, however, Stora Enso was among the best performing companies. As can be expected, the performance of Oji Paper (fifth largest) reflects the Japanese average and is very poor. This points to the effect of the Asian financial crisis, which is examined in the next section. Smurfit-Stone Container Corp., the seventh largest in the world, is consistently a very poor performer. The company does not move at all during the experiment, being found in Group E during all years. The company consistently shows low profitability and liquidity, and very low solidity. With the notable exception of Stora Enso, performance among the top companies is very poor, particularly in profitability ratios. In the Top 150 list from 1998 (Matusek et al., 1999), the Top Five still included Kimberly-Clark and UPM-Kymmene (currently eighth and ninth). These companies, in particular Kimberly-Clark, are very good performers, as will be shown in later in the chapter. The consolidation of the industry during the past few years has led to very large, but also largely inefficient companies.
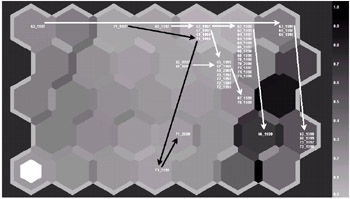
The Impact of the Asian Financial CrisisDuring the nineties, the Asian economy was hard hit by the financial crisis. This means that it will have affected many companies during a long period. However, the peak of the crisis was during 1997 98 (Corsetti, Pesenti, & Roubini, 1998), and should therefore show most dramatically during the years 1998 and 1999. As was mentioned in an earlier discussion, financial information for the year 2000 was very hard to find for Japanese companies. Therefore, only a few companies could be included for 2000. Figure 8 illustrates the Japanese companies during the years 1997 99. Movements by the companies are illustrated using solid white arrows.
The effect of the crisis is obvious on the map. Although Japanese companies already appear to be performing worse than western companies (as discussed earlier), the trend towards even worse performance during the years 1998 and 1999 is obvious. The most dramatic example of this is Daishowa Paper Manufacturing (Company No. 63), which moved from Group A2 (excellent) to Group E (very poor) in three years. The same can be said, for example, of Nippon Paper Industries (No. 69), Daio Paper (No. 62), Mitsubishi Paper (No. 67), and Hokuetsu Paper Mills (No. 65), although the effect has not been as dramatic as for Daishowa Paper Manufacturing. Some companies appear unaffected and remain in the same node throughout the years 1997 99. Examples of such companies are Tokai Pulp & Paper (No. 74), Rengo (No. 72), and Chuetsu Paper (No. 64). The only example of the opposite behavior is Pilot (No. 71, illustrated using solid black arrows), which improves from Group D in 1998 to Group B in 1999 2000. It is remarkable that, apart from Pilot, no Japanese company improved its positioning on the map during the years 1997 99. This is proof of the heavy effect that the crisis has had on the Japanese economy.
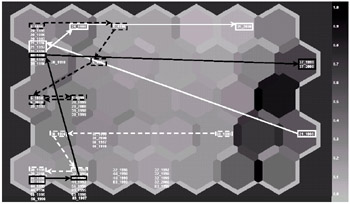
The Best PerformersIn Figure 9, the best performing companies are shown. The criterion for being selected was that the company could be found in Group A during at least three years during the period 1995 99.
A number of interesting changes in companies' positions can be observed on the map in Figure 9. Some of the companies show a dramatic improvement in performance over the years. For example, Caraustar Industries (No. 21, solid white arrow) moves from being in Group E during 1995, to four straight years (1996 99) in Group A2. Caraustar attributes this increase to completed acquisitions and lower raw material costs. However, in 2000, the company drops back into Group D. In its annual report, Caraustar states that this dramatic decrease in profitability is primarily due to restructuring and other nonrecurring costs, and also to a certain extent, higher energy costs and lower volumes. Kimberly-Clark exhibits a similar increase (No. 30, dashed white arrow), moving from the poor end of the map in 1995, to Group A1 during 1996 99. Kimberly-Clark explains the poor performance of 1995 with the merger between Kimberly-Clark and Scott Paper Company. The merger required the sale of several profitable businesses in order to satisfy U.S. and European competition authorities. The merger also caused a substantial one-time charge of 1,440 million USD, decreasing profitability further. However, profitability was back up again in 1996, and remained excellent through to 2000. On the other hand, Riverwood Holding (No. 37, solid black arrow) goes from Group A1 in 1995 97, to Group A2 in 1998, and Group E in 1999 00. This decrease in performance is rather dramatic, and can, according to Riverwood, be attributed to lower sales volumes in its international folding cartonboard markets. This was primarily due to weak demand in Asia, and to the effect of the canceling of a number of low-margin businesses in the U.K. Some of the consistently best-performing companies include Wausau-Mosinee Paper (No. 44), Schweitzer-Mauduit Intl (No. 39), Buckeye Technologies (No. 20), UPM-Kymmene (No. 5, dashed black arrows), and Donohue (No. 56, which was acquired by Abitibi Consolidated in 2000).
The Poorest PerformersThe poorest performing companies are illustrated in Figure 10. The criterion for being selected was that the company could be found in Group E (the poorest group) during at least three years.
This map also shows some dramatic movement. Crown Vantage (No. 24, solid black arrow) is perhaps the most dramatic example; in one year, the company fell from Group A2 (1995) to Group E (1996 99). Crown Vantage states in its annual report that the reason for its poor performance in 1996 is the low price of coated ground-wood paper, and that when it spun off from James River Corporation (now Fort James) at the end of 1995, Crown Vantage assumed a large amount of debt. Crown Vantage was unable to pay this debt, and applied for a Chapter 11 (bankruptcy) on March 15, 2000. Year 2000 data is therefore not available. Doman Industries (No. 54, solid white arrows) exhibits similar, through not as dramatic, behavior. Doman falls from Group B (1995) to settle in Group D or E throughout the rest of the experiment. According to Doman, this was due to a poor pulp market. In 1997, the market for pulp improved, only to decline again in 1998. Doman cites the Asian financial crisis as the reason for the second drop, primarily the declining market in Japan. Temple-Inland (No. 42, dashed white arrow) falls from Group B in 1995 to Group E in 1997, from where it rises back to Group B in 2000. Temple-Inland states weak demand and lowered prices for corrugated packaging as the reason for this decline in 1997. An example of the opposite behavior is Reno de Medici (No. 81, dashed black arrows), which moves from Group D in 1995, through Group E in 1996, to Group A2 in 1999. However, the company falls back into Group E in 2000. A number of companies identified as very poor performers are also illustrated on the map. These are Crown Vantage (No. 24, solid black arrows), Gaylord Container Corp (No. 26), Jefferson-Smurfit Corp (No. 29), and Settsu (No. 73).
| |||||||||||||||||||||||||||||||||
| | |||||||||||||||||||||||||||||||||
EAN: 2147483647
Pages: 194

