Filtering Project Details
Another useful way to change the way you view Project task and resource information is by filtering. As the name suggests, filtering hides task or resource data that does not meet the criteria you specify, displaying only the data you’re interested in. Like grouping, filtering does not change the data in your Project plan; it just changes the way that data appears.
There are two ways to use filters. Either apply predefined filters to a view, or apply an AutoFilter to a view:
-
Apply a predefined or custom filter to see or highlight only the task or resource information that meets the criteria of the filter. For example, the Critical Task filter displays only the tasks on the critical path. Some predefined filters, such as the Task Range filter, prompt you to enter specific criteria—for example, a range of task IDs. If a task or resource sheet view has a filter applied, the filter name appears in the Filter button on the Formatting toolbar.
-
Use AutoFilters for ad hoc filtering in any table in Project. When the AutoFilter feature is turned on, small arrows appear next to the names of column headings. Click the arrow to display a list of criteria by which you can filter the data. Which criteria you see depends on the type of data contained in the column—for example, AutoFilter criteria in a date column include choices like Today and This month, as well as a Custom option, with which you can specify your own criteria. You use AutoFilter in Project in the same way you might use AutoFilter in Excel.
Both types of filters hide rows in task or resource sheet views that do not meet the criteria you specify. You might see gaps in the task or resource ID numbers. The “missing” data is only hidden and not deleted. As with sorting and grouping, when you filter data in a view, the filtering applies to all tables you can display in the view. Views that do not include tables, such as the Calendar and Network Diagram views, also support filtering (through the Filtered For command on the Project menu), but not AutoFilters.
A commonly used format for communicating schedule information on a film project is called a shooting schedule. In this exercise, you create a filter that displays only the uncompleted film shoot tasks. In later sections, you’ll combine this filter with a custom table and a custom view to create a complete shooting schedule for everyone on the film project.
-
On the View menu, click Gantt Chart.
The Gantt Chart view appears. Before you create a filter, you’ll quickly see the tasks you’re interested in by applying an AutoFilter.
-
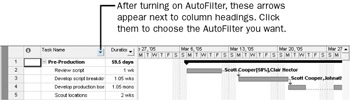
On the Formatting toolbar, click the AutoFilter button.
Project displays arrows to the right of the column headings. Your screen should look like the following illustration:
-
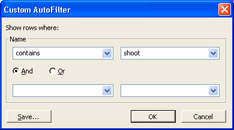
Click the down arrow in the Task Name column heading, and then click (Custom).
The Custom AutoFilter dialog box appears. You’d like to see just the tasks that contain the word shoot.
-
Under Name, make sure contains appears in the first box.
-
In the adjacent box, type shoot.
-
Click OK to close the Custom AutoFilter dialog box.
Project filters the task list to show only the tasks that contain the word shoot and their summary tasks. Your screen should look similar to the following illustration:
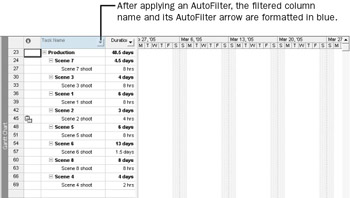
Note that the Task Name column heading and arrow appear in blue. These are visual indicators that an AutoFilter has been applied to this view.
Next you turn off the AutoFilter and create a custom filter.
-
On the Formatting toolbar, click the AutoFilter button.
Project toggles the AutoFilter off, redisplaying all tasks in the project plan. Now you are ready to create a custom filter.
-
On the Project menu, point to Filtered For: All Tasks, and then click More Filters.
The More Filters dialog box appears:
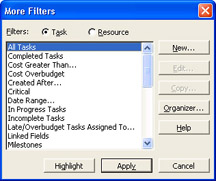
In this dialog box you can see all the predefined filters for tasks (when in a task view) and resources (when in a resource view) available to you.
-
Click the New button.
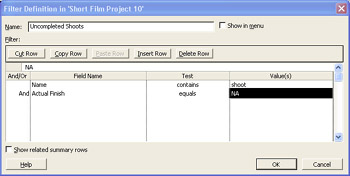
The Filter Definition in dialog box appears.
-
In the Name box, type Uncompleted Shoots.
-
In the first row in the Field Name column, type or select Name.
-
In the first row in the Test column, select contains.
-
In the first row in the Value(s) column, type shoot.
That covers the first criterion for the filter; next you’ll add the second criterion.
-
In the second row in the And/Or column, select And.
-
In the second row in the Field Name column, type or select Actual Finish.
-
In the second row in the Test column, select equals.
-
In the second row in the Value(s) column, type NA.
NA means “not applicable” and is the way Project marks some fields that have no value yet. In other words, any shooting task that does not have an actual finish date must be uncompleted.
-
Click OK to close the Filter Definition in dialog box.
The new filter appears in the More Filters dialog box.
-
Click the Apply button.
Project applies the new filter to the Gantt Chart view. Your screen should look similar to the following illustration:
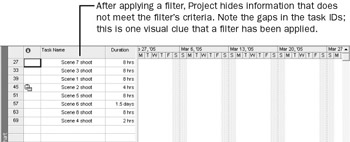
Now the tasks are filtered to show only the uncompleted shooting tasks. Because we haven’t started tracking actual work yet, all the shooting tasks are uncompleted at this time.
Tip Rather than hiding tasks that do not meet the filter criteria, you can highlight those that do in blue. Click the Highlight button instead of the Apply button in the More Filters dialog box.
To conclude this exercise, you will remove the filtering.
-
On the Project menu, point to Filtered For: Uncompleted Shoots, and then click All Tasks.
Project removes the filter. As always, displaying or removing a filter has no effect on the original data.
Tip All filters are also available to you through the Filter button on the Formatting toolbar. The name of the active filter appears in this button; click the arrow next to the filter name to see other filters. If no filter is applied to the current view, All Tasks or All Resources appears on the button, depending on the type of view currently displayed.
To learn more about the filters available in Project, type About filters or Available filters into the Search box in the upper right corner of the Project window.
EAN: 2147483647
Pages: 199