Section 2.10. The Process File System
2.10. The Process File SystemThe process file system, procfs, is a pseudo file system. Pseudo file systems provide file-like abstractions and file I/O interfaces to something that is not a file in the traditional sense. Procfs abstracts the Solaris kernel's process architecture such that all processes running on the system appear in the root directory name space under the /proc directory; every process in the system exists as a file under /proc, with the process's PID serving as the file name. The PID file name under /proc is actually a directory containing other files and subdirectories that, combined, make up the complete /proc directory space. The many kernel data structures that provide process data and control points appear as files within the /proc/ <pid> directory hierarchy, and multithreaded processes have a subdirectory for each LWP in the process. Per-LWP data and control structures exist as files under the /proc/<pid>/lwp/<lwp_id>. The objects that appear under /proc are not on-disk files; they are objects that exist in kernel memory. When a user executes an ls(1) command in /proc or any /proc subdirectory, the system reads kernel memory. This file-like abstraction for processes provides a simple and elegant means of extracting information about processes, their execution environment, and their kernel resource utilization. Simple things, such as opening a /proc file object to read bits of information about a process, are relatively easy to do with procfs. Process control is powerful and relatively straightforward; processes can be stopped and started, and event-driven stops can be established for things like signals, traps, and system calls. In general, process management and debugging is greatly simplified. It is worth noting that the original design goal of procfs was to provide a set of interfaces for writing debuggers; procfs has evolved considerably since the original implementation. The Solaris system ships with several commands that implement /proc for extracting information and issuing control directives. These commands are described in the proc(1) manual page. We use some of these commands throughout the book to provide examples of different kernel abstractions, such as opened files or a process's address space. Process information commands, ps(1) and prstat(1), are built on top of the procfs interfaces. The control and informational data made available through the /proc file system is maintained in a hierarchy of files and subdirectories. The files and subdirectories implemented in /proc are listed below. See the proc(4) manual page for additional information on these files and their uses.
The LWP subdirectories contain per-lwp information.
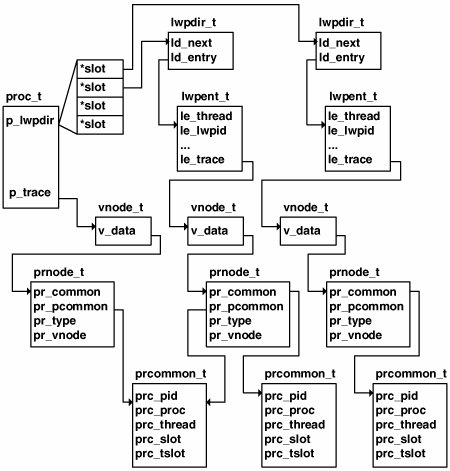
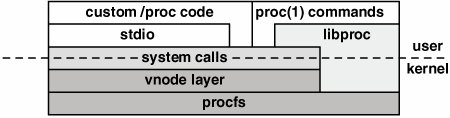
Refer to the proc(4) manual page for more detailed information on the various files in /proc and for a complete description of the control messages available. 2.10.1. Procfs ImplementationProcfs is implemented as a dynamically loadable kernel module, /kernel/fs/ procfs, and is loaded automatically by the system at boot time. /proc is mounted during system startup by virtue of the default /proc entry in the /etc/vfstab file. The mount phase causes the invocation of the procfs prinit() (initialize) and prmount() file-system-specific functions, which initialize the vfs structure for procfs and create and initialize a vnode for the top-level directory file, /proc. The kernel memory space for the /proc files is, for the most part, allocated dynamically, with an initial static allocation for the number of directory slots required to support the maximum number of processes the system is configured to support (see Section 2.5). A kernel procdir (procfs directory) pointer is initialized as a pointer to an array of procent (procfs directory entry) structures. The size of this array is derived from the v.v_proc variable established at boot time, representing the maximum number of processes the system can support. The entry in procdir maintains a pointer to the process structure and maintains a link to the next entry in the array. The procdir array is indexed through the pr_slot field in the process's pid structure. The procdir slot is allocated to the process from the array and initialized at process creation time (fork()) (see Figure 2.4). The specific format of the procfs directory entries is described in the procfs kernel code. It is modeled after a typical on-disk file system: Each directory entry in the kernel is described with a directory name, offset into the directory, a length field, and an inode number. The inode number for a /proc file object is derived internally from the file object type and process PID. Note that /proc directory entries are not cached in the directory name lookup cache (dnlc); by definition they are already in physical memory. Because procfs is a file system, it is built on the virtual file system (VFS) and vnode framework. In Solaris, an instance of a file system is described by a vfs object, and the underlying files are each described by a vnode. Procfs builds the vfs and vnode structures, which are used to reference the file-system-specific functions for operations on the file systems (for example, mount, unmount), and file-system-specific functions on the /proc directories and file objects (for example, open, read, write). Beyond the vfs and vnode structures, the procfs implementation defines two primary data structures that describe file objects in the /proc file system. The first, prnode, is the file-system-specific data linked to the vnode. Just as the kernel UFS implementation defines an inode as a file-system-specific structure that describes a UFS file, procfs defines a prnode to describe a procfs file. Every file in the /proc directory has a vnode and prnode. typedef struct prnode { vnode_t *pr_next; /* list of all vnodes for process */ uint_t pr_flags; /* private flags */ kmutex_t pr_mutex; /* locks pr_files and child pr_flags */ prnodetype_t pr_type; /* node type */ mode_t pr_mode; /* file mode */ ino_t pr_ino; /* node id (for stat(2)) */ uint_t pr_hatid; /* hat layer id for page data files */ prcommon_t *pr_common; /* common data structure */ prcommon_t *pr_pcommon; /* process common data structure */ vnode_t *pr_parent; /* parent directory */ vnode_t **pr_files; /* contained files array (directory) */ uint_t pr_index; /* position within parent */ vnode_t *pr_pidfile; /* substitute vnode for old /proc */ vnode_t *pr_realvp; /* real vnode, file in object,fd dirs */ proc_t *pr_owner; /* the process that created this node */ vnode_t *pr_vnode; /* pointer to vnode */ struct contract *pr_contract; /* contract pointer */ int pr_cttype; /* active template type */ } prnode_t; See usr/src/uts/common/fs/proc/prdata.h The second structure, prcommon, resides at the directory level for /proc direc-tory files. That is, the /proc/<pid> and /proc/<pid>/lwp/<lwpid> directories each link to a prcommon structure. The underlying nondirectory file objects within /proc/<pid> and /proc/<pid>/lwp/<lwpid> do not have an associated prcommon structure. The reason is that prcommon's function is the synchronization of access to the file objects associated with a process or an LWP within a process. /* * Common file object to which all /proc vnodes for a specific process * or lwp refer. One for the process, one for each lwp. */ typedef struct prcommon { kmutex_t prc_mutex; /* to wait for the proc/lwp to stop */ kcondvar_t prc_wait; /* to wait for the proc/lwp to stop */ ushort_t prc_flags; /* flags */ uint_t prc_writers; /* number of write opens of prnodes */ uint_t prc_selfopens; /* number of write opens by self */ pid_t prc_pid; /* process id */ model_t prc_datamodel; /* data model of the process */ proc_t *prc_proc; /* process being traced */ kthread_t *prc_thread; /* thread (lwp) being traced */ int prc_slot; /* procdir slot number */ id_t prc_tid; /* thread (lwp) id */ int prc_tslot; /* lwpdir slot number, -1 if reaped */ int prc_refcnt; /* this structure's reference count */ struct pollhead prc_pollhead; /* list of all pollers */ } prcommon_t; See usr/src/uts/common/fs/proc/prdata.h The prcommon structure provides procfs clients with a common file abstraction of the underlying data files within a specific directory. Structure linkage is maintained at the proc structure and LWP level, which reference their respective /proc file vnodes. Every process links to its primary /proc vnode (that is, the vnode that represents the /proc/<pid> file), and maintains an LWP directory list reference to the per-LWP /proc entries. /* * An lwp directory entry. * If le_thread != NULL, this is an active lwp. * If le_thread == NULL, this is an unreaped zombie lwp. */ typedef struct lwpent { kthread_t *le_thread; /* the active lwp, NULL if zombie */ id_t le_lwpid; /* its lwpid (t->t_tid) */ uint16_t le_waiters; /* total number of lwp_wait()ers */ uint16_t le_dwaiters; /* number that are daemons */ clock_t le_start; /* start time of this lwp */ struct vnode *le_trace; /* pointer to /proc lwp vnode */ } lwpent_t; /* * Elements of the lwp directory, p->p_lwpdir[]. * * We allocate lwp directory entries separately from lwp directory * elements because the lwp directory must be allocated as an array. * The number of lwps can grow quite large and we want to keep the * size of the kmem_alloc()d directory as small as possible. * * If ld_entry == NULL, the entry is free and is on the free list, * p->p_lwpfree, linked through ld_next. If ld_entry != NULL, the * entry is used and ld_next is the thread-id hash link pointer. */ typedef struct lwpdir { struct lwpdir *ld_next; /* hash chain or free list */ struct lwpent *ld_entry; /* lwp directory entry */ } lwpdir_t; . . . struct proc { . . . kthread_t *p_tlist; /* circular list of threads */ lwpdir_t *p_lwpdir; /* thread (lwp) directory */ lwpdir_t *p_lwpfree; /* p_lwpdir free list */ lwpdir_t **p_tidhash; /* tid (lwpid) lookup hash table */ uint_t p_lwpdir_sz; /* number of p_lwpdir[] entries */ uint_t p_tidhash_sz; /* number of p_tidhash[] entries */ . . . struct vnode *p_trace; /* pointer to primary /proc vnode */ struct vnode *p_plist; /* list of /proc vnodes for process */ . . . See usr/src/uts/common/sys/proc.h Indexing of the process p_lwpdir is based on the /proc directory entry slot for the target LWP. The lwpent_t references the vnode for an LWP's /proc/<pid>/ lwp/<lwpid>/ through the vnode and prnode_t, as illustrated in Figure 2.10. Figure 2.10. Procfs Structures Figure 2.10 shows a single process with two LWPs that link to the underlying procfs objects. Each LWP in the process links to its procfs prnode tHRough the lwpent_t vnode path shown. The LWP's prnode links back to the process's prnode through the pr_pcommon pointer. The connection to the /proc directory slot is through the process's pid_t pr_slot link (not shown in Figure 2.10; see Figure 2.4). /proc/<pid>/lwp/<lwpid> slots are linked for each LWP in their respective prc_tslot field. When a reference is made to a procfs directory and underlying file object, the kernel dynamically creates the necessary structures to service a client request for file I/O. More succinctly, the procfs structures and links are created and torn down dynamically. They are not created when the process is created (aside from the procdir procfs directory entry and directory slot allocation). They appear to be always present because the files are available whenever an open(2) request is made or a lookup is done on a procfs directory or data file object. (It is something like the light in your refrigeratorit's always on when you look, but off when the door is closed). The data made available through procfs is, of course, always present in the kernel proc structures and other data structures that, combined, form the complete process model in the Solaris kernel. By hiding the low-level details of the kernel process model and abstracting the interesting information and control channels in a relatively generic way, procfs provides a service to client programs interested in extracting bits of data about a process or somehow controlling the execution flow. The abstractions are created when requested and are maintained as long as necessary to support file access and manipulation requests for a particular file. File I/O operations through procfs follow the conventional methods of first opening a file to obtain a file descriptor, then performing subsequent read/write operations, and closing the file when the operation is completed. The creation and initialization of the prnode and prcommon structures occur when the procfs-specific vnode operations are entered through the vnode switch table mechanism as a result of a client (application program) request. The actual procfs vnode operations have specific functions for the lookup and read operations on the directory and data files within the /proc directory. The implementation in procfs of lookup and read requests through an array of function pointers that resolve to the procfs file-type-specific routine is accomplished through the use of a lookup table and corresponding lookup functions. The file type is maintained at two levels. At the vnode level, procfs files are defined as VPROC file types (v_type field in the vnode). The prnode includes a type field (pr_type) that defines the specific procfs file type being described by the pnode. /* * Node types for /proc files (directories and files contained therein). */ typedef enum prnodetype { PR_PROCDIR, /* /proc */ PR_SELF, /* /proc/self */ PR_PIDDIR, /* /proc/<pid> */ PR_AS, /* /proc/<pid>/as */ PR_CTL, /* /proc/<pid>/ctl */ PR_STATUS, /* /proc/<pid>/status */ PR_LSTATUS, /* /proc/<pid>/lstatus */ PR_PSINFO, /* /proc/<pid>/psinfo */ . . . See usr/src/uts/common/fs/proc/prdata.h The procfs file types correspond directly to the description of /proc files and directories that are listed at the beginning of this section (and in the proc(2) man page). The vnode kernel layer is entered (vn_open()), and a series of lookups is performed to construct the full path name of the desired /proc file. Macros in the vnode layer invoke file-system-specific operations. In this example, VOP_LOOKUP() resolves to the procfs pr_lookup() function. pr_lookup() checks access permissions and vectors to the procfs function appropriate for the directory file type, for example, pr_lookup_piddir() to perform a lookup on a /proc/<pid> direc-tory. Each of the pr_lookup_xxx() directory lookup functions does some directory-type-specific work and calls prgetnode() to fetch the prnode. prgetnode() creates the prnode for the /proc file and initializes several of the prnode and vnode fields. For /proc PID and LWPID directories (/proc/ <pid>, /proc/<pid>/lwp/<lwpid>), the prcommon structure is created, linked to the prnode, and partially initialized. Note that for /proc directory files, the vnode type is changed from VPROC (set initially) to VDIR, to correctly reflect the file type as a directory (it is a procfs directory, but a directory file nonetheless). Once the path name is fully constructed, the VOP_OPEN() macro invokes the file-system-specific open() function. The procfs propen() code does some additional prnode and vnode field initialization and file access testing for specific file types. Once propen() completes, control is returned to vn_open() and ultimately a file descriptor representing a procfs file is returned to the caller. The reading of a procfs data file object is similar in flow to the open scenario, in which the execution of a read system call on a procfs file ultimately causes the code to enter the procfs prread() function. For each available file object (data structure), the procfs implementation defines a specific read function: pr_read_psinfo(), pr_read_pstatus(), pr_read_lwpsinfo(), etc. The specific function is entered from prread() tHRough an array of function pointers indexed by the file typethe same method employed for the previously described lookup operations. The Solaris 10 implementation of procfs, in which both 32-bit and 64-bit binary executables can run on a 64-bit kernel, provides 32-bit versions of the data files available in the /proc hierarchy. For each data structure that describes the contents of a /proc file object, a 32-bit equivalent is available in a 64-bit Solaris kernel (for example, lwpstatus and lwpstatus32, psinfo and psinfo32). In addition to the 32-bit structure definitions, each of the pr_read_xxx() functions has a 32-bit equivalent in the procfs kernel modulea function that deals specifically with the 32-bit data model of the calling program. Procfs users are not exposed to the multiple data model implementation in the 64-bit kernel. When prread() is entered, it checks the data model of the calling program and invokes the correct function as required by the data model of the caller. An exception to this is a read of the address space (/proc/<pid>/as) file; the caller must be the same data model. A 32-bit binary cannot read the as file of a 64-bit process. A 32-bit process can read the as file of another 32-bit process running on a 64-bit kernel. The pr_read_xxx() functions essentially read the data from its original source in the kernel and write the data to the corresponding procfs data structure fields, thereby making the requested data available to the caller. For example, pr_read_psinfo() reads data from the targeted process's proc structure, credentials structure, and address space (as) structure and writes it to the corresponding fields in the psinfo structure. Access to the kernel data required to satisfy the client requests is synchronized with the proc structure's mutex lock, plock. This approach protects the per-process or LWP kernel data from being accessed by more than one client thread at a time. Writes to procfs files are much less frequent. Aside from writing to the directories to create data files on command, writes are predominantly to the process or LWP control file (ctl) to issue control messages. Control messages (documented in proc(1)) include stop/start messages, signal tracing and control, fault management, execution control (for example, system call entry and exit stops), and address space monitoring. Note We've discussed I/O operations on procfs files in terms of standard system calls because currently those calls are the only way to access the /proc files from developer-written code. However, a set of interfaces specific to procfs is used by the proc(1) commands that ship with Solaris. These interfaces are bundled into a libproc.so library and are not currently documented or available for public use. The libproc.so library is included in the /usr/lib distribution in Solaris 10, but the interfaces are evolving and not yet documented. Plans are under way to document these libproc.so interfaces and make them available as a standard part of the Solaris APIs. The diagram in Figure 2.11 shows more than one path into the procfs kernel routines. Typical developer-written code makes use of the shorter system call path, passing through the vnode layer as previously described. The proc(1) command is built largely on the libproc.so interfaces. The need for a set of library-level interfaces specific to procfs is twofold: An easy-to-use set of routines for code development reduces the complexity of using a powerful kernel facility; the complexity in controlling the execution of a process, especially a multithreaded process, requires a layer of code that really belongs at the application programming interface (as opposed to kernel) level. Figure 2.11. libproc and procfs The developer controls a process by writing an operation code and (optional) operand to the first 8 bytes of the control file (or 16 bytes if it's an LP64 kernel). The control file write path is also through the vnode layer and ultimately enters the procfs prwritectl() function. The implementation allows multiple control messages (operations and operands) to be sent to the control file in a single write. The prwritectl() code breaks multiple messages into distinct operation/operand pairs and passes them to the kernel pr_control() function, where the appropriate flags are set at the process or LWP level as a notification that a control mechanism (for example, a stop on an event) has been injected. Table 2.4 lists the possible control messages (operations) that are currently implemented. We include them here to provide context for the subsequent descriptions of control functions, as well as to illustrate the power of procfs. See also the proc(1) manual page and /usr/include/sys/procfs.h.
As you can see from the variety of control messages provided, the implementation of process/LWP control is tightly integrated with the kernel process/LWP subsystem. Various fields in the process, user (uarea), LWP, and kernel thread structures facilitate process management and control with procfs. Establishing process control involves setting flags and bit mask fields to track events that cause a process or thread to enter or exit the kernel. These events are signals, system calls, and fault conditions. The entry and exit points for these events are well defined and thus provide a natural inflection point for control mechanisms. The system calls, signals, and faults are set through the use of a set data type, where sigset_t, sysset_t, and fltset_t operands have values set by the calling (controlling) program to specify the signal, system call, or fault condition of interest. A stop on a system call entry occurs when the kernel is first entered (the system call trap), before the argument list for the system call is read from the process. System call exit stops have the process stop after the return value from the system call has been saved. Fault stops also occur when the kernel is first entered; fault conditions generate traps, which force the code into a kernel trap handler. Signal stops are tested for at all the points where a signal is detected, on a return from a system call or trap, and on a wakeup (see Section 2.11). Address space watch directives allow a controlling process to specify a virtual address, range (in bytes), and access type (for example, read or write access) for a segment of a process's virtual address space. When a watched event occurs, a watchpoint trap is generated, which typically causes the process or LWP to stop, either through a trace of a FLTWATCH fault or by an unblocked SIGTRAP signal. In some cases, the extraction of process information and process control requires the controlling process to have the target process perform specific instructions on its behalf. For example, the pfiles(1) command, which lists the open files of a process and provides information about each opened file, requires the target process to issue a stat(2) system call on each of its open file descriptors. Since the typical process running on a Solaris system spends a fair amount of its time blocking on a system call (not related to procfs), getting control of the target process to perform a specific task requires grabbing the process while it is blocked and preserving the system call state so that it can be restored and resume properly when the controlling process has had its request satisfied. Procfs implements an agent LWP for this purpose. Rather than complicating state preservation and restoration by using an existing LWP in the target process, procfs provides a facility for creating an agent LWP (note the PCAGENT control message). When an agent LWP is created, it remains the only runnable LWP in the process for the duration of its existence. The agent LWP controls the execution of the target process as required to satisfy the controlling process's request (for example, execute system calls within the target process). When completed, the agent LWP is destroyed and the process/LWP state is restored. The proc structure maintains a pointer, p_agenttp, that is linked to the agent LWP when one is created. A test on this pointer in various areas of the kernel determines whether an agent LWP exists for the process. The finer details of the process control directives, their use, and the subtleties of the behavior they create are well documented in the proc(4) man page. Among its many benefits, procfs enables us to track and extract information about process resource utilization and state changesthe subject of the next section. 2.10.2. Process Resource UsageThe kernel supports the gathering of relatively fine-grained resource-utilization information in the process framework. Resource usage data is a collection of counters embedded in a structure called lrusage. A process contains two lrusage structuresp_ru, which is the total for all completed LWPs; and p_cru, which tallies usage for child processes. Each LWP contains an lrusage (lwp_ru in klwp_t) structure that is updated during the execution life cycle of the LWP. When an LWP terminates, the lrusage data is copied from the LWP to the process-level lrusage structure. Thus, the data reflected at the process level represents the sum total for all the LWPs in the process. Table 2.5 describes the lrusage counters.
The resource utilization counters do not require microstate accounting enabling for the process or LWP. The counters are accessible through the usage structure maintained by procfs, where /proc/<pid>/usage represents the process-level usage and /proc/<pid>/lwp/<lwp_id>/lwpusage represents the per-LWP usage data. Within the process, the operating system maintains a high-resolution timestamp that marks process start and terminate times. A p_mstart field, the process start time, is set in the kernel fork() code when the process is created, and the process termination time, p_mterm, is set in the kernel exit() code. Start and termination times are also maintained in the LWP when microstate accounting is enabled. The associated process's p_mlreal field contains a sum of the LWP's elapsed time, as derived from the start and terminate times. The system uses an internal gethrtime() routine, get_high_resolution_time (there is an equivalent gethrtime(3C) API). When get_high_resolution_time is called, it returns a 64-bit value expressed in nanoseconds. The value is not related to current time and thus is only useful when used in conjunction with a subsequent call to gethrtime(). In that case, the difference in the return values from the first call and the second call yields a high-resolution measurement of elapsed time in nanoseconds. This is precisely how it is used when microstate accounting is enabled. For example, the difference between the value of p_mstart, which is set during process creation, and p_mterm, which is set when the process terminates, yields the elapsed time of the process. p_mlreal is the sum total elapsed time, taken in a similar fashion, for the process's LWPs. The fine-grained, nanosecond-level values are derived from a hardware register in the processor that maintains a count of CPU clock cycles (on UltraSPARC processors, it's the TICK register). Processor-specific conversion routines convert the register value to nanoseconds, based on processor clock speeds. 2.10.3. Microstate AccountingThe kernel also supports the notion of microstate accounting, that is, the timing of low-level processing states. Microstate accounting is the fine-grained retrieval of time values taken during one of several possible state changes that can occur during the lifetime of a typical LWP. The timestamps are maintained in arrays at the LWP and process level. As was the case with resource utilization, the LWP microstates are recorded during execution, and the array in the process is updated when the LWP terminates. The microstate accounting (and resource usage) structures for the process and LWP are shown below. /* * Microstate accounting, resource usage, and real-time profiling */ hrtime_t p_mstart; /* hi-res process start time */ hrtime_t p_mterm; /* hi-res process termination time */ hrtime_t p_mlreal; /* elapsed time sum over defunct lwps */ hrtime_t p_acct[NMSTATES]; /* microstate sum over defunct lwps */ hrtime_t p_cacct[NMSTATES]; /* microstate sum over child procs */ struct lrusage p_ru; /* lrusage sum over defunct lwps */ struct lrusage p_cru; /* lrusage sum over child procs */ ... See usr/src/uts/common/sys/proc.h /* * Microstate accounting. Timestamps are made at the start and the * end of each microstate (see <sys/msacct.h> for state definitions) * and the corresponding accounting info is updated. The current * microstate is kept in the thread struct, since there are cases * when one thread must update another thread's state (a no-no * for an lwp since it may be swapped/paged out). The rest of the * microstate stuff is kept here to avoid wasting space on things * like kernel threads that don't have an associated lwp. */ struct mstate { int ms_prev; /* previous running mstate */ hrtime_t ms_start; /* lwp creation time */ hrtime_t ms_term; /* lwp termination time */ hrtime_t ms_state_start; /* start time of this mstate */ hrtime_t ms_acct[NMSTATES]; /* per mstate accounting */ } lwp_mstate; See usr/src/uts/common/sys/klwp.h Microstate accounting is enabled by default in Solaris 10 (it was disabled by default in previous Solaris releases). Microstate accounting enabled is reflected in a flag at the process level (SMSACCT in the proc structure's p_flag field) and at the LWP/kthread level (TP_MSACCT in the t_proc_flag field). The kernel lwp_create() code tests the process-level SMSACCT flag to determine if microstate accounting has been enabled. If it has, then lwp_create() sets the TP_MSACCT flag in the kernel thread. lwp_create() also initializes the microstate accounting structure, lwp_mstate, regardless of the state of the SMSACCT flag. This allows the kernel to set the start time (ms_start in the LWP's lwp_mstate structure) and initialize the ms_acct[] array. The kernel implementation of microstate accounting requires only four kernel functions:
At various points, the kernel code tests the TP_MSACCT flag to determine if microstate accounting is enabled; if it is, the code updates the current microstate by a call into the new_mstate() function, which is passed as an argument flag indicating the new microstate. The actual microstates are shown below. /* LWP microstates */ #define LMS_USER 0 /* running in user mode */ #define LMS_SYSTEM 1 /* running in sys call or page fault */ #define LMS_TRAP 2 /* running in other trap */ #define LMS_TFAULT 3 /* asleep in user text page fault */ #define LMS_DFAULT 4 /* asleep in user data page fault */ #define LMS_KFAULT 5 /* asleep in kernel page fault */ #define LMS_USER_LOCK 6 /* asleep waiting for user-mode lock */ #define LMS_SLEEP 7 /* asleep for any other reason */ #define LMS_WAIT_CPU 8 /* waiting for CPU (latency) */ #define LMS_STOPPED 9 /* stopped (/proc, jobcontrol, lwp_suspend) */ . . . See usr/src/uts/common/sys/msacct.h The microstate measurements are taken as follows: init_mstate() initializes the microstate date of a new LWP/kthread when the LWP/kthread is created. The init_mstate() function performs the following actions (see the previous page).
The LWP/kthread microstate data is thus initialized before executing for the first time. The above initialization steps show two additional microstate-related fields not yet discussed. In the kernel thread structure, the current microstate is maintained in t_mstate, and t_waitrq calculates CPU wait time. You will see where this comes into play in a moment. During execution, if TP_MSACCT is set, calls are made to the new_mstate() routine when a state transition occurs. The caller passes new_mstate() a state flag (LMS_USER, LMS_SYSTEM, etc.) that stipulates the new state. The system calculates the time spent in the previous state by finding the difference between the current return value of gethrtime() and the ms_state_start field, which was set during initialization and is reset on every pass through new_mstate(), marking the start time for a new state transition. The ms_acct[] array location that corresponds to the previous microstate is updated to reflect elapsed time in that state. Since the time values are summed, the current value in the ms_acct[] location is added to the new elapsed time just calculated. Thus, the ms_acct[] array contains the elapsed time in the various microstates, updated dynamically when state changes occur. Lastly, the kernel thread's t_mstate is set to reflect the new microstate. The calls into new_mstate() for the tracked microstates come from several areas in the kernel. Table 2.6 lists the kernel functions that call new_mstate() for specific state changes.
The last function to discuss apropos of microstate accounting is restore_mstate(), which is called from a few places in the dispatcher code to restore the microstate of an LWP just selected for execution. restore_mstate() calculates the microstate time value spent in the previous state (typically, a sleep) by using the same basic algorithm described for the new_mstate() function; the previous state is restored from the ms_prev field (lwp_mstate structure). When LWP/kthreads terminate, the microstate accounting data in the ms_acct[] array and the resource usage counters are added to the values in the corresponding locations in the proc structure. Again, the process level resource counters and microstate accounting data reflect all LWP/kthreads in the process. Tracking LWP microstates in Solaris 10 is a snap with prstat(1). Use the -mL flags, which provide microstate columns for each LWP (thread) in the process. The prstat(1) output shows the percentage of time spent in a given microstate over the last sampling period (default is 5 seconds), beginning with the USR column, up to and including the LAT column. The values in the columns USR through LAT should total 100, accounting for 100% of the threads time for the last sampling period. See the prstat(1) man page. sol9$ prstat -mL PID USERNAME USR SYS TRP TFL DFL LCK SLP LAT VCX ICX SCL SIG PROCESS/LWPID 985 mauroj 22 0.0 0.0 0.0 0.0 11 0.0 66 21 103 31 0 tds/3 985 mauroj 17 0.0 0.0 0.0 0.0 7.9 0.0 75 19 79 27 0 tds/2 985 mauroj 13 0.0 0.0 0.0 0.0 34 0.0 52 14 58 21 0 tds/6 985 mauroj 10 0.0 0.0 0.0 0.0 56 0.0 33 21 44 28 0 tds/4 985 mauroj 9.9 0.0 0.0 0.0 0.0 51 0.0 39 18 63 26 0 tds/9 985 mauroj 9.4 0.0 0.0 0.0 0.0 48 0.0 43 19 41 29 0 tds/5 985 mauroj 9.1 0.0 0.0 0.0 0.0 69 0.0 22 15 42 18 0 tds/8 985 mauroj 7.7 0.0 0.0 0.0 0.0 46 0.0 46 20 36 27 0 tds/7 986 mauroj 0.0 0.1 0.0 0.0 0.0 0.0 100 0.0 41 0 287 0 prstat/1 689 mauroj 0.0 0.1 0.0 0.0 0.0 0.0 100 0.1 112 0 632 0 java/11 664 mauroj 0.0 0.0 0.0 0.0 0.0 0.0 100 0.1 25 0 64 0 gnome-netsta/1 689 mauroj 0.0 0.0 0.0 0.0 0.0 0.0 100 0.3 130 0 214 0 java/33 704 mauroj 0.0 0.0 0.0 0.0 0.0 0.0 100 0.1 21 0 44 0 gnome-termin/1 689 mauroj 0.0 0.0 0.0 0.0 0.0 0.0 100 0.3 142 0 89 0 java/8 473 mauroj 0.0 0.0 0.0 0.0 0.0 0.0 100 0.0 20 0 80 10 Xorg/1 . . . Total: 71 processes, 210 lwps, load averages: 1.20, 0.27, 0.09 |
EAN: 2147483647
Pages: 244