Buffer Overflows
| You're probably familiar with the term "buffer overflow," but if not, a buffer overflow is a software bug in which data copied to a location in memory exceeds the size of the reserved destination area. When an overflow is triggered, the excess data corrupts program information adjacent to the target buffer, often with disastrous consequences. Buffer overflows are the most common type of memory corruption. If you're not familiar with how these bugs are exploited, they almost seem to defy logic and somehow grant an attacker complete access to a vulnerable system. But how do they work? Why are they such a threat to system integrity? And why don't operating systems just protect memory from being corrupted altogether? To answer these questions, you need to be familiar with program internals and how the CPU and OS manage processes. Note Some of the vulnerabilities in this book are more complex memory corruption vulnerabilities that aren't technically buffer overflows, but share many of the same characteristics. This discussion of exploitability is largely applicable to these types of issues, especially the "Assessing Memory Corruption Impact" section later in this chapter. Process Memory LayoutA process can be laid out in memory in any way the host OS chooses, but nearly all contemporary systems observe a few common conventions. In general, a process is organized into the following major areas:
Although this is a high-level view of how process memory is organized, it shows how the impact of a buffer overflow vulnerability varies based on where the buffer is located. The following sections address common and unique attack patterns associated with each location. Stack OverflowsStack overflows are buffer overflows in which the target buffer is located on the runtime program stack. They are the most well understood and, historically, the most straightforward type of buffer overflow to exploit. This section covers the basics of the runtime program stack and then shows how attackers exploit stack-based buffer overflows.
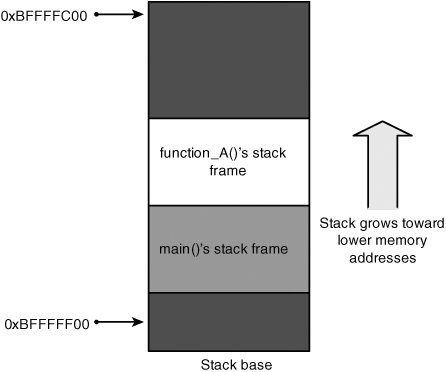
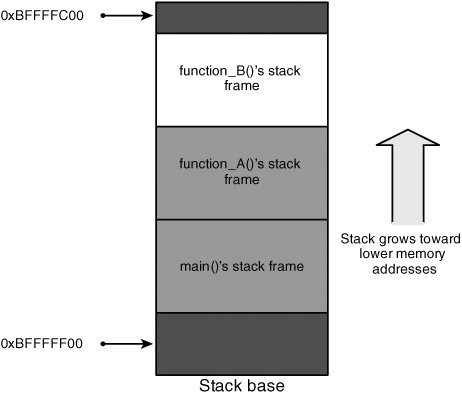
The Runtime StackEach process has a runtime stack, which is also referred to as "the program stack," "the call stack," or just "the stack." The runtime stack provides the underpinning necessary for the functions used in every structured programming language. Functions can be called in arbitrary order, and they can be recursive and mutually recursive. The runtime stack supports this functionality with activation records, which record the chain of calls from function to function so that they can be followed back when functions return. An activation record also includes data that needs to be allocated each time a function is called, such as local variables, saved machine state, and function parameters. Because runtime stacks are an integral part of how programs function, they are implemented with CPU assistance instead of as a pure software abstraction. The processor usually has a special register that points to the top of the stack, which is modified by using push() and pop() machine instructions. On Intel x86 CPUs, this register is called ESP (ESP stands for "extended stack pointer"). On most modern CPUs, the stack grows downward. This means the stack starts at a high address in virtual memory and grows toward a lower address. A push operation subtracts from the stack pointer so that the stack pointer moves toward the lower end of process memory. Correspondingly, the pop operation adds to the stack pointer, moving it back toward the top of memory. Every time a function is called, the program creates a new stack frame, which is simply a reserved block of contiguous memory that a function uses for storing local variables and internal state information. This block of memory is reserved for exclusive use by the function until it returns, at which time it's removed from the stack. To understand this process, consider the following program snippet: int function_B(int a, int b) { int x, y; x = a * a; y = b * b; return (x+y); } int function_A(int p, int q) { int c; c = p * q * function_B(p, p); return c; } int main(int argc, char **argv, char **envp) { int ret; ret = function_A(1, 2); return ret; }When function_A() is entered, a stack frame is allocated and placed on the top of the stack, as shown in Figure 5-1. Figure 5-1. Stack while in function_A() This diagram is a simplified view of the program stack, but you can see the basic stack frame layout when the main() function has called function_A(). Note Figures 5-1 and 5-2 might seem confusing at first because the stack appears to be growing upward rather than downward; however, it's not a mistake. If you imagine a memory address space beginning at 0 and extending downward to 0xFFFFFFFF, a lower memory address is closer to 0 and, therefore, appears higher on the diagram. Figure 5-2. Stack while in function_B() Figure 5-2 shows what the stack would look like after function_A() calls function_B(). When function_B() is finished, it returns back into function_A(). The function_B() stack frame is popped off the top of the stack, and the stack again looks like it does in Figure 5-1. This simply means the value of ESP is restored to the value it had when function_B() was called. Note The stack diagrams in Figures 5-1 and 5-2 are simplified representations. In fact, main() is not the first function on the call stack. Usually, functions are called before main() to set up the environment for the process. For example, glibc Linux systems usually begin with a function named _start(), which calls _libc_start_main(), which in turn calls main(). Each function manages its own stack frame, which is sized depending on how many local variables are present and the size of each variable. Local variables need to be accessed directly as the function requires them, which would be inefficient just using push and pop instructions. Therefore, many programs make use of another register, called the "frame pointer" or "base pointer." On Intel x86 CPUs, this register is called EBP (EBP stands for "extended base pointer"). This register points to the beginning of the function's stack frame. Each variable in the given frame can be accessed by referencing a memory location that is a fixed offset from the base pointer. The use of the base pointer is optional, and it is sometimes omitted, but you can assume that it's present for the purposes of this discussion. A crucial detail that was glossed over earlier is the internal state information recorded in each stack frame. The state information stored on the stack varies among processor architectures, but usually it includes the previous function's frame pointer and a return address. This return address value is saved so that when the currently running function returns, the CPU knows where execution should continue. Of course, the frame pointer must also be restored so that local variable accesses remain consistent after a function has called a subfunction that allocates its own stack frame.
The stack pointer must also be restored to its previous state, but this task isn't performed implicitly; the called function must reset the stack pointer to the appropriate location before it returns. This is necessary because the saved frame pointer and return address are restored from the top of the stack. The frame pointer is restored by using a pop instruction, which uses the stack pointer implicitly; the ret instruction used to return from a function also uses ESP implicitly to retrieve the return address. Each function that allocates its own stack frame, therefore, needs to save its own frame pointer. Listing 5-1 shows a typical function prologue on Intel machines for saving the frame pointer. Listing 5-1. Function Prologue
The prologue doesn't require that the caller specifically push the return address onto the stack; this task is done by the call instruction. So the stack layout when function_B() is called looks like Figure 5-3. Figure 5-3. Detailed stack layout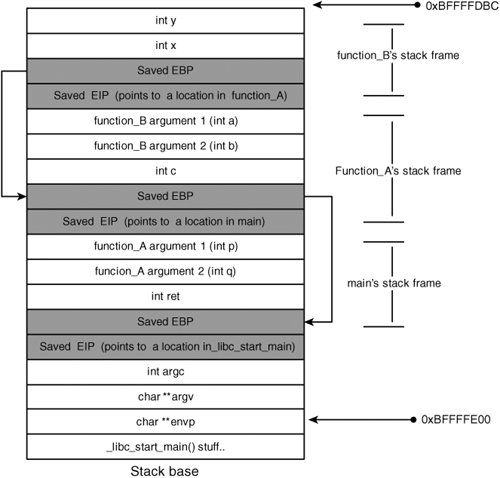 Note You might notice that the prologue in Listing 5-1 includes a seemingly useless instruction (mov edi, edi). This instruction is actually a placeholder added to ease runtime patching for system monitoring and debugging. Exploiting Stack OverflowsAs you can see, local variables are in close proximity to each otherin fact, they are arranged contiguously in memory. Therefore, if a program has a vulnerability allowing data to be written past the end of a local stack buffer, the data overwrites adjacent variables. These adjacent variables can include other local variables, program state information, and even function arguments. Depending on how many bytes can be written, attackers might also be able to corrupt variables and state information in previous stack frames. Note Compilers sometimes add padding between one variable and the next, depending on several factors such as optimization levels and variable sizes. For the purposes of this discussion, you can consider variables to be contiguous. To begin, consider the simple case of writing over a local variable. The danger with writing over a local variable is that you can arbitrarily change the variable's value in a manner the application didn't intend. This state change can often have undesirable consequences. Consider the example in Listing 5-2. Listing 5-2. Off-by-One Length Miscalculation
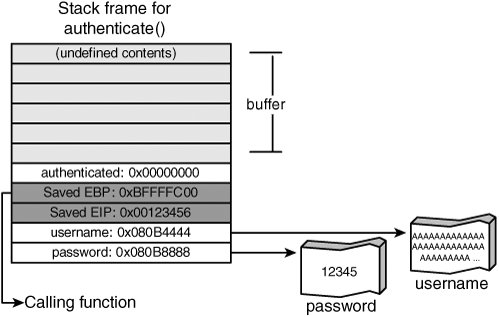
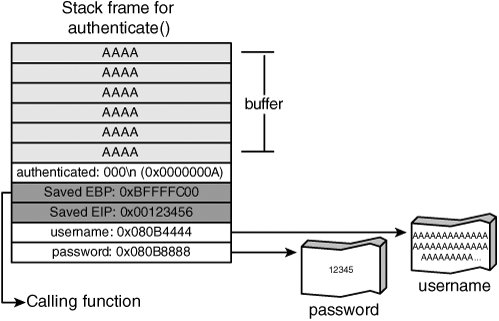
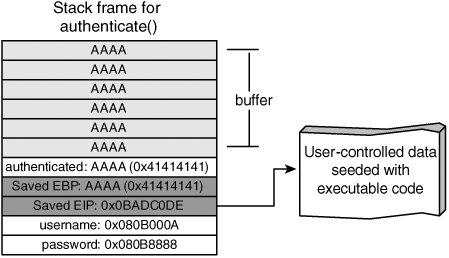
Assume that the authenticated variable is located at the top of the stack frame, placing it at a higher memory location than the buffer variable. The function's stack looks like Figure 5-4. Figure 5-4. Stack frame of authenticate() before exploit Note Figure 5-4 demonstrates one possible layout for Listing 5-2; however, you can't conclusively determine from source code how variables are ordered internally in a stack frame. The compiler can (and often does) reorder variables for optimization purposes. The authenticate() function has a buffer overflow. Specifically, the sprintf() function doesn't limit the amount of data it writes to the output buffer. Therefore, if the username string is around 1024 bytes, data is written past the end of the buffer variable and into the authenticated variable. (Remember that authenticated() is at the top of the stack frame.) Figure 5-5 shows what happens when the overflow is triggered. Figure 5-5. Stack frame of authenticate() after exploit The authenticated variable is a simple state variable, indicating whether the user was able to successfully log on. A value of zero indicates that authentication failed; a nonzero value indicates success. By overflowing the buffer variable, an attacker can overwrite the authenticated variable, thus making it nonzero. Therefore, the caller incorrectly treats the attacker as successfully authenticated! Overwriting adjacent local variables is a useful technique, but it's not generally applicable. The technique depends on what variables are available to overwrite, how the compiler orders the variables in memory, and what the program does with them after the overflow happens. A more general technique is to target the saved state information in every stack framenamely, the saved frame pointer and return address. Of these two variables, the return address is most immediately useful to attackers. If a buffer overflow can overwrite the saved return address, the application can be redirected to an arbitrary point after the currently executing function returns. This process is shown in Figure 5-6. Figure 5-6. Overwriting the return address Essentially, the attacker chooses an address in the program where some useful code resides and overwrites the return address with this new address. The exact location depends on what the attacker wants to achieve, but there are two basic options:
SEH AttacksWindows systems can be vulnerable to a slight variation on the traditional stack overflow attacks; this variation is known as "smashing the structured exception handlers." Windows provides structured exception handling (SEH) so that programs can register a handler to act on errors in a consistent manner. When a thread causes an exception to be thrown, the thread has a chance to catch that exception and recover. Each time a function registers an exception handler, it's placed at the top of a chain of currently registered exception handlers. When an exception is thrown, this chain is traversed from the top until the correct handler type is found for the thrown exception. If no appropriate exception handler is found, the exception is passed to an "unhandled exception filter," which generally terminates the process. Note Exception handling is a feature of a number of languages and was popularized by the C++ programming language. Although C++ exception handling (EH) is significantly more complex than the basic Windows SEH mechanism, C++ exceptions in Windows are implemented on top of SEH. If you would like to learn more about Windows C++ exception handling, you should check out the write-up at www.openrce.org/articles/full_view/21. SEH provides a convenient method for exploiting stack overflows on a Windows system because the exception handler registration structures are located on the stack. Each structure has the address of a handler routine and a pointer to its parent handlers. These structures are shown in Figure 5-7. Figure 5-7. Windows SEH layout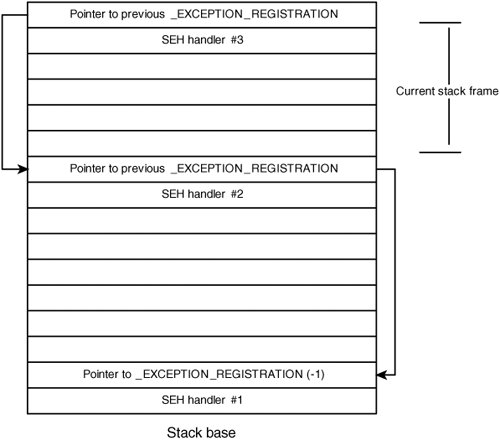 When an exception occurs, these records are traversed from the most recently installed handler back to the first one. At each stage, the handler is executed to determine whether it's appropriate for the currently thrown exception. (This explanation is a bit oversimplified, but there's an excellent paper describing the process at www.microsoft.com/msj/0197/exception/exception.aspx.) Therefore, if an attacker can trigger a stack overflow followed by any sort of exception, these exception registration structures are examined, and the exception handler address in each structure is called until an appropriate one is found. Because they are structures on the attacker-corrupted stack, the application jumps to an address of the attacker's choosing. When it's possible to overflow a buffer by a fairly large amount, the attacker can copy over the entire stack, resulting in an exception when the stack base is overwritten. The application then uses the corrupted SEH information on the stack and jumps to an arbitrary address. This process is depicted in Figure 5-8. Figure 5-8. SEH exploit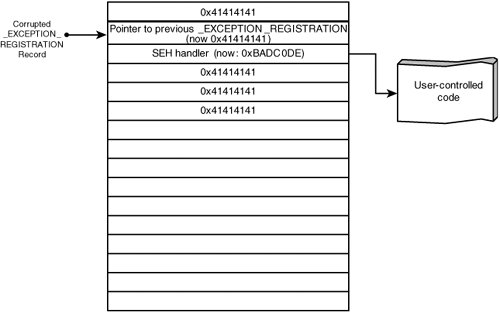 Off-by-One ErrorsMemory corruption is often caused by calculating the length of an array incorrectly. Among the most common mistakes are off-by-one errors, in which a length calculation is incorrect by one array element. This error is typically caused by failing to account for a terminator element or misunderstanding the way array indexing works. Consider the following example: ... void process_string(char *src) { char dest[32]; for (i = 0; src[i] && (i <= sizeof(dest)); i++) dest[i] = src[i]; ...The process_string() function starts by reading a small number of characters from its argument src and storing them to the stack-based buffer dest. This code attempts to prevent a buffer overflow if src has more than 32 characters, but it has a simple problem: It can write one element out of bounds into dest. Array indexes begin with 0 and extend to sizeof(array) - 1, so an array with 32 members has valid array indexes from 0 through 31. The preceding code indexes one element past the end of dest, as the condition controlling the loop is (i <= sizeof(dest)) when it should be (i < sizeof(dest)). If i is incremented to a value of 32 in the vulnerable code, it passes the length check, and the program sets dest[32] equal to src[32]. This type of issue surfaces repeatedly in code dealing with C strings. C strings require storage space for each byte of the string as well as one additional byte for the NUL character used to terminate the string. Often this NUL byte isn't accounted for correctly, which can lead to subtle off-by-one errors, such as the one in Listing 5-3. Listing 5-3. Off-by-One Length Miscalculation
This code uses the strlen() function to check that there's enough room to copy the username into the buffer. The strlen() function returns the number of characters in a C string, but it doesn't count the NUL terminating character. So if a string is 1024 characters according to strlen(), it actually takes up 1025 bytes of space in memory. In the get_user() function, if the supplied user string is exactly 1024 characters, strlen() returns 1024, sizeof() returns 1024, and the length check passes. Therefore, the strcpy() function writes 1024 bytes of string data plus the trailing NUL character, causing one byte too many to be written into buf. You might expect that off-by-one miscalculations are rarely, if ever, exploitable. However, on OSs running on Intel x86 machines, these errors are often exploitable because you can overwrite the least significant byte of the saved frame pointer. As you already know, during the course of program execution, each function allocates a stack frame for local variable storage. The address of this stack frame, known as the base pointer or frame pointer, is kept in the register EBP. As part of the function prologue, the program saves the old base pointer to the stack, right next to the return address. If an off-by-one buffer overflow is triggered on a buffer located directly below the saved base pointer, the NUL byte is written one byte past the end of the buffer, which corresponds to the least significant byte of the saved base pointer. This means when the function returns, the restored base pointer is incorrect by up to 255 bytes, as shown in Figure 5-9. Figure 5-9. Off-by-one stack frame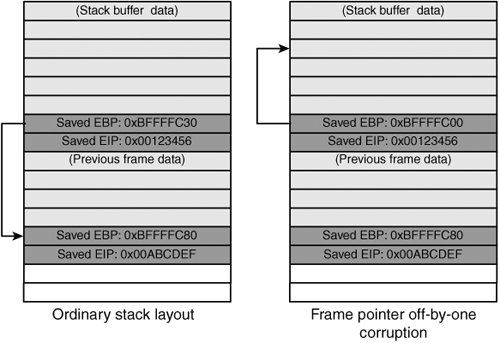 If the new base pointer points to some user-controllable data (such as a character buffer), users can then specify local variable values from the previous stack frame as well as the saved base pointer and return address. Therefore, when the calling function returns, an arbitrary return address might be specified, and total control over the program can be seized. Off-by-one errors can also be exploitable when the element is written out of bounds into another variable used by that function. The security implications of the off-by-one error in this situation depend on how the adjacent variable is used subsequent to the overflow. If the variable is an integer indicating size, it's truncated, and the program could make incorrect calculations based on its value. The adjacent variable might also affect the security model directly. For example, it might be a user ID, allowing users to receive permissions they aren't entitled to. Although these types of exploits are implementation specific, their impact can be just as severe as generalized attacks. Heap OverflowsHeap overflows are a more recent advance in exploitation. Although common now, general heap exploitation techniques didn't surface until July 2000. These techniques were originally presented by an accomplished security researcher known as Solar Designer. (His original advisory is available at www.openwall.com/advisories/OW-002-netscape-jpeg/.) To understand how heap exploitation works, you need to be familiar with how the heap is managed. The following sections cover the basics of heap management and show how heap-based buffer overflows are exploited. Heap ManagementAlthough heap implementations vary widely, some common elements are present in most algorithms. Essentially, when a call to malloc() or a similar allocation routine is made, some memory is fetched from the heap and returned to the user. When this memory is deallocated by using free(), the system must mark it as free so that it can be used again later. Consequently, state must be kept for regions of memory that are returned to the callers so that memory can be handed out and reclaimed efficiently. In many cases, this state information is stored inline. Specifically, most implementations return a block of memory to the user, which is preceded by a header describing some basic characteristics of the block as well as some additional information about neighboring memory blocks. The type of information in the block header usually includes the following:
Note BSD systems manage heap memory differently from most other OSs. They store most block information out of band. Free blocks are often chained together using a standard data structure, such as a singly or doubly linked list. Most heap implementations define a minimum size of a block big enough to hold pointers to previous and next elements in a list and use this space to hold pointers when the block isn't in use. Figure 5-10 is an example of the two basic block structures specific to glibc malloc() implementations. Figure 5-10. Glibc heap structure Note that the organization of blocks in this way means that triggering an overflow results in corrupting header information for allocated memory chunks as well as list management data. Exploiting Heap OverflowsAs you might have guessed, the ability to modify header data and list pointers arbitrarily (as when a buffer overflow occurs) gives attackers the opportunity to disrupt the management of heap blocks. These disruptions can be used to manipulate block headers to gain reliable arbitrary execution by leveraging the heap maintenance algorithms, especially list maintenance of free blocks. After its initial discovery by Solar Designer, this process was described in depth in Phrack 57 (www.phrack.org/phrack/57/p57-0x09). The following list summarizes the standard technique:
To understand why unlinking a chunk leads to an arbitrary overwrite, consider the following code for unlinking an element from a doubly linked list: int unlink(ListElement *element) { ListElement *next = element->next; ListElement *prev = element->prev; next->prev = prev; prev->next = next; return 0; }This code removes a ListElement by updating pointers in adjacent elements of the list to remove references to the current element, element. If you could specify the element->next and element->prev values, you would see that this code unwittingly updates arbitrary memory locations with values you can control. This process is shown before unlinking in Figure 5-11 and after unlinking in Figure 5-12. Figure 5-11. Linked list before unlink operation Figure 5-12. Linked list after unlink operation Being able to overwrite a memory location with a controllable value is usually all that attackers need to gain control of a process. Many useful values can be overwritten to enable attackers to compromise the application. A few popular targets include the following:
Global and Static Data OverflowsGlobal and static variables are used to store data that persists between different function calls, so they are generally stored in a different memory segment than stack and heap variables are. Normally, these locations don't contain general program runtime data structures, such as stack activation records and heap chunk data, so exploiting an overflow in this segment requires application-specific attacks similar to the vulnerability in Listing 5-2. Exploitability depends on what variables can be corrupted when the buffer overflow occurs and how the variables are used. For example, if pointer variables can be corrupted, the likelihood of exploitation increases, as this corruption introduces the possibility for arbitrary memory overwrites. |
EAN: 2147483647
Pages: 194
