Monitoring Data Loads
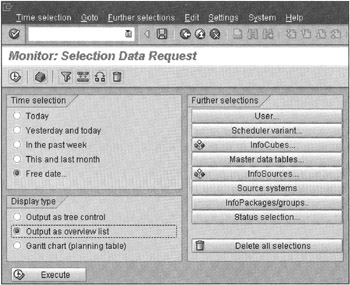
SAP BW provides an excellent data load monitoring utility to check running data loads or those that have been executed in the past. You also have the option to view data load jobs started by a user or by an InfoCube or other parameters, as shown in Figure 9-18 in the Further selections options. Clicking the Monitor icon in the application menu bar of SAP BW Administrator Workbench launches this utility. The inverted tree icons on the selection buttons in Figure 9-18 show that you will view data load activities for selected InfoCubes and InfoSources.

Figure 9-18: SAP BW Data Load Monitoring Environment in SAP BW 2.0A.
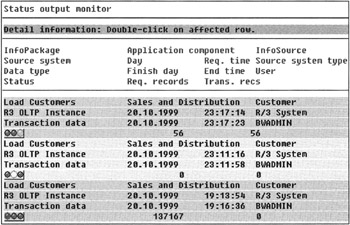
Note that Figure 9-18 shows the data load monitoring facility for SAP BW 2.0A. You will see a new option, Output as tree control, in the Display type section. This option displays monitoring statistics in a tree format. Clicking the Execute button, you will see results in tree, overview list, or Gantt chart format. Figure 9-19 shows an output list of selected data loads. The traffic-light symbols represent the state of individual data loads. Green indicates that the data load was successful. Yellow means either that the job is still in progress or a state could not be resolved. Red means fatal errors have occurred and need to be resolved.

Figure 9-19: Data Load Job Statistics Summary. The Lights (Green, Red, and Yellow) Show the Current State of Individual Jobs.
| Note | Often, yellow indicates an unknown or in-limbo state. Drill down for detailed data load information and identify its cause. The red light timer is a global setting. When a data load job exceeds that set time, the red light turns on and remains red even if the data load job completes successfully. If this happens quite often, change the Waiting time until light turns red in Monitor parameter value in the SAP BW global settings. |
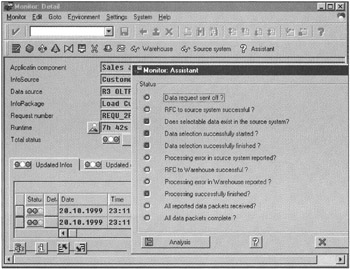
For further details, click on an individual traffic-light symbol. This opens a Monitor Assistant window, as shown in Figure 9-20, and details incoming data packet information. Monitor Assistant shows all steps needed to successfully process incoming data. For further details, click the Analysis button. This will provide more information to help resolve the problems. When you exit Monitor Assistant, you can look at individual data records that are in SAP BW, edit individual records, simulate processing, and reload the corrected data in the data warehouse.

Figure 9-20: Monitor Assistant (Renamed Wizard in BW 2.0) Displays the State of Individual Data Load Tasks.
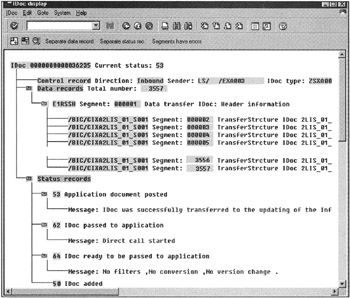
When the problem resides in the source system, you need to look at the data sets generated in the source system to identify the root cause. To do a complete end-to-end problem resolution from within the Monitor facility, you can view IDOCs generated in the source system by checking IDOCs in the source system boxes on the bottom of the window, as shown in Figure 9-21. Select a row with yellow or red traffic-light symbols and click the Analyze Tool icon on the bottom left of the window. Here you will be able to view IDOCs current and previous content. After correcting erroneous records, update records in the SAP BW warehouse manually or restart the data load job using current IDOCs.

Figure 9-21: Data Load Detailed Analysis to Identify and Resolve Update Problems.
Often, when you request full data loads from an SAP R/3 data source, you receive an "Error in the source system..." message. The problem probably is not with the data but rather that you have update mode enabled for the LIS structures. Use transaction OMO1 or OMO2 to disable LIS structure update mode and resubmit the full data load. And remember to reset it as soon as you finish your data loads.
| Team-Fly |
EAN: 2147483647
Pages: 174