Scoring Models
| For selecting among several alternatives according to various criteria, a scoring model is a method similar to AHP, but it is mathematically simpler. There are several versions of scoring models. In the scoring model that we will use, the decision criteria are weighted in terms of their relative importance, and each decision alternative is graded in terms of how well it satisfies the criteria, according to the following formula: S i = where
To demonstrate the scoring model, we will use an example. Sweats and Sweaters is a chain of stores specializing in cotton apparel. The company wants to open a new store in one of four malls around the Atlanta metropolitan area. The company has indicated five criteria that are important in its decision about where to locate: proximity of schools and colleges, area median income, mall vehicle traffic flow and parking, quality and size (in terms of number of stores in the mall), and proximity of other malls or shopping areas. The company has weighted each of these criteria in terms of its relative importance in the decision-making process, and it has analyzed each potential mall location and graded them according to each criterion as shown in the following table:
The scores, S i , for the decision alternative are computed as follows : S 1 = (.30)(40) + (.25)(75) + (.25)(60) + (.10)(90) + (.10)(80) = 62.75 S 2 = (.30)(60) + (.25)(80) + (.25)(90) + (.10)(100) + (.10)(30) = 73.50 S 3 = (.30)(90) + (.25)(65) + (.25)(79) + (.10)(80) + (.10)(50) = 76.00 S 4 = (.30)(60) + (.25)(90) + (.25)(85) + (.10)(90) + (.10)(70) = 77.75 Because mall 4 has the highest score, it would be the recommended decision, followed by mall 3, mall 2, and finally mall 1. Scoring Model with Excel SolutionThe steps included in computing the scores of the decisions in the scoring model are relatively simple and straightforward. Exhibit 9.16 shows a spreadsheet set up for the Sweats and Sweaters store location example. The formula that computes the score for mall 1 in cell D10, =SUMPRODUCT (C5:C9, D5:D9) , is shown on the formula bar at the top of the spreadsheet. This formula is copied and pasted using the right mouse button into cells E10, F10, and G10. Exhibit 9.16.(This item is displayed on page 417 in the print version)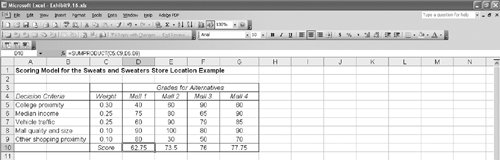 | |||||||||||||||||||||||||||||||||||||||||||||||||||

EAN: 2147483647
Pages: 358