Tool 213: Venn Diagram
| AKA | N/A |
| Classification | Evaluating/Selecting (ES) |
Tool description
A Venn diagram can be used to identify logical relationships, and it is very useful in displaying the union and intersection of events or sets. It can graphically illustrate the mutually exclusive concept and other rules of probability or the outcome of an experiment.
Typical application
-
To illustrate the relationship of events, sets, or behavior.
-
To help understand the consequences when two events intersect or are combined.
-
To test the validity of a syllogism by applying logical thinking.
Problem-solving phase
| → | Select and define problem or opportunity |
| Identify and analyze causes or potential change | |
| → | Develop and plan possible solutions or change |
| Implement and evaluate solution or change | |
| Measure and report solution or change results | |
| Recognize and reward team efforts |
Typically used by
| 2 | Research/statistics |
| 1 | Creativity/innovation |
| Engineering | |
| Project management | |
| Manufacturing | |
| Marketing/sales | |
| Administration/documentation | |
| Servicing/support | |
| Customer/quality metrics | |
| Change management |
before
-
Influence Diagram
-
Morphological Analysis
-
Organization Mapping
-
Double Reversal
-
Starbursting
after
-
Mental Imaging
-
Fresh Eye
-
Forced association
-
Cluster Analysis
-
Truth Table
Notes and key points
-
Developed by John Venn (1978), a Venn diagram is shown as a rectangle that contains the "sample space" with circles drawn inside to represent all possibilities of interaction and noninteraction of events. To gain more insight into applications within the field of possibility and logic, a textbook on statistics should be referenced.
Step-by-step procedure
-
STEP 1 Identify events or sets and their relationships, interactions or outcomes that may be better understood using a Venn diagram. See example Venn Diagram Applications.
-
STEP 2 Construct a Venn diagram, designate the circles and provide explanations. Run-it-by others for their comments.
-
STEP 3 Display in training sessions or presentations to facilitate conceptual understanding.
-
STEP 4 Identify examples to illustrate the concept.
Example of tool application
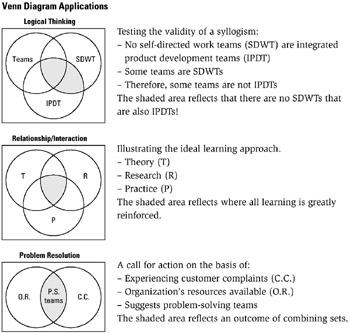
Venn Diagram Applications
EAN: 2147483647
Pages: 326