Tool 212: Variance Analysis
| AKA | Variance Matrix |
| Classification | Analyzing/Trending (AT) |
Tool description
A variance analysis tool discovers key process variances or deviations from specifications in a selected process for the purpose of reducing or controlling the serious impact these variances have on service or product quality. In addition, variance analysis allows a closer look at process cycle time, waste, rework, supplier quality, and overall costs.
Typical application
-
To utilize a variance analysis tool after a team has completed process mapping in problem-solving efforts.
-
To document key variances that have an overall negative affect on product quality.
-
To identify process capability and deviations from customer requirements.
-
To perform continuous process improvement and cycle time reduction activities.
Problem-solving phase
| → | Select and define problem or opportunity |
| → | Identify and analyze causes or potential change |
| Develop and plan possible solutions or change | |
| Implement and evaluate solution or change | |
| → | Measure and report solution or change results |
| Recognize and reward team efforts |
Typically used by
| Research/statistics | |
| Creativity/innovation | |
| Engineering | |
| Project management | |
| 3 | Manufacturing |
| Marketing/sales | |
| Administration/documentation | |
| Servicing/support | |
| 2 | Customer/quality metrics |
| 1 | Change management |
before
-
Brainstorming
-
Standard Deviation
-
Process Capability Ratios
-
Control Chart
-
Process Mapping
after
-
Pareto Diagram
-
Cause and Effect Diagram (CED)
-
Analysis of Variance
-
Activity analysis
-
Shewhart PDCA Cycle
Notes and key points
-
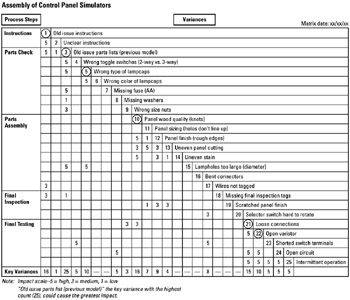
Variance analysis matrix construction:
-
Ensure that all process steps are included and sequenced properly in the matrix. A process map will provide this information.
-
Use a consistent level of detail in listing all variances.
-
Focus on identified key variances that potentially can cause the greatest impact (problems) on the process.
-
Variance impact scale: 5 = high, 3 = medium, 1 = low
-
12 = variance # 12
-
13 = key variance
-
Key variance control table.
-
Key Variance Control Table Examples
| Key Variance | Root Cause? | Where Observed? | Where Controlled? | How Changed |
|---|---|---|---|---|
| #3-Old issue parts list | Incorrect documents | Supply/kitting | Engineering repro | Revise documents |
| #10-Panel wood quality | Defective wood | Parts assembly | Customer complaints | Change supplier |
| #21-Loose connections | Untightened nuts | Final testing | Assembly operator | Operator training |
Step-by-step procedure
-
STEP 1 As a first step, the team process maps a selected process so that all participants acquire a greater understanding of the process.
-
STEP 2 Next, the team reaches consensus on the input and output requirements based on design criteria and customer expectations.
-
STEP 3 The team's facilitator explains the concepts of a variance analysis and draws a variance analysis matrix on a whiteboard or on flip charts.
-
STEP 4 Participants agree on the major process steps and sequentially list all known or potential process variances.
-
STEP 5 The team establishes variance impact criteria and assigns numerical values to variances that would affect other activities. See example Assembly of Control Panel Simulators.
-
STEP 6 Key variances are identified by adding all impact values underneath each listed variance. The highest totals are considered key variances and their respective variance numbers are circled, as shown in this example.
-
STEP 7 Next, a variance control table is constructed. This table is used to hold all team-identified key variances.
-
STEP 8 Systematically, the team completes this table. An example is shown in notes and key points. The completion of this table will greatly enhance a team's ability to reduce or at least control the key variances that impact the quality of products or services.
-
STEP 9 Finally, the variance analysis matrix is dated and presented to the process owners.
Example of tool application
EAN: 2147483647
Pages: 326