Section 22.3. SVG: Scalable Vector Graphics
22.3. SVG: Scalable Vector GraphicsSVG is an XML grammar for graphics. The word "vector" in its name indicates that it is fundamentally different from raster image formats such as GIF, JPEG, and PNG that specify a matrix of pixel values. Instead, an SVG "image" is a precise, resolution-independent (hence "scalable") description of the steps necessary to draw the desired graphic. Here is what a simple SVG image looks like in text format: <!-- Begin an SVG figure and declare our namespace --> <svg xmlns="http://www.w3.org/2000/svg" viewBox="0 0 1000 1000"> <!-- Coordinate system for figure --> <defs> <!-- Set up some definitions we'll use --> <linearGradient > <!-- a color gradient named "fade" --> <stop offset="0%" stop-color="#008"/> <!-- Start a dark blue --> <stop offset="100%" stop-color="#ccf"/> <!-- Fade to light blue --> </linearGradient> </defs> <!-- Draw a rectangle with a thick black border and fill it with the fade --> <rect x="100" y="200" width="800" height="600" stroke="black" stroke-width="25" fill="url(#fade)"/> </svg> Figure 22-3 shows what this SVG file looks like when rendered graphically. Figure 22-3. A simple SVG graphic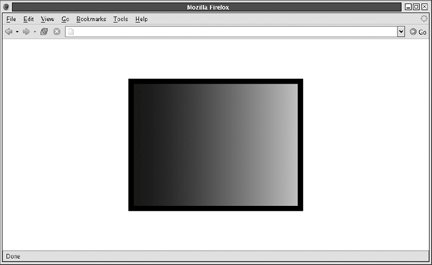 SVG is a large and moderately complex grammar. In addition to simple shape-drawing primitives, it includes support for arbitrary curves, text, and animation. SVG graphics can even incorporate JavaScript scripts and CSS stylesheets to add behavior and presentation information. This section shows how client-side JavaScript code (embedded in HTML, not in SVG) can dynamically draw graphics using SVG. It includes examples of SVG drawing but can only scratch the surface of what is possible with SVG. Full details about SVG are available in the comprehensive, but quite readable, specification. The specification is maintained by the W3C at http://www.w3.org/TR/SVG/. Note that this specification includes a complete Document Object Model for SVG documents. This section manipulates SVG graphics using the standard XML DOM and does not use the SVG DOM at all. At the time of this writing, the only mainstream web browser to support SVG graphics natively is Firefox 1.5. In this browser, you can display an SVG graphic simply by typing the URL of the image you want to display. More usefully, SVG graphics can be embedded directly into an XHTML file, like this simple one: <?xml version="1.0"?> <!-- declare HTML as default namespace and SVG with "svg:" prefix --> <html xmlns="http://www.w3.org/1999/xhtml" xmlns:svg="http://www.w3.org/2000/svg"> <body> This is a red square: <!-- This is HTML text --> <svg:svg width="10" height="10"> <!-- This is an SVG image --> <svg:rect x="0" y="0" width="10" height="10" fill="red"/></svg:svg> This is a blue circle: <svg:svg width="10" height="10"> <svg:circle cx="5" cy="5" r="5" fill="blue"/></svg:svg> </html> Figure 22-4 shows how Firefox 1.5 renders this XHTML document. Figure 22-4. SVG graphics in an XHTML document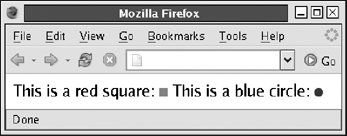 SVG images can also be embedded in an HTML document using an <object> tag so that they can be displayed using a plug-in. Adobe has a free (but not open source) SVG viewer plug-in that works with common browsers and operating systems. You can find it by following links from http://www.adobe.com/svg. Since SVG is an XML grammar, drawing SVG graphics is simply a matter of using the DOM to create appropriate XML elements. Example 22-8 is a listing of a pieChart( ) function that creates the SVG elements to produce a pie chart like that shown in Figure 22-5. (The other vector-graphics technologies explored in this chapter will also be used to draw pie charts very similar to this one.) Figure 22-5. An SVG pie chart built with JavaScript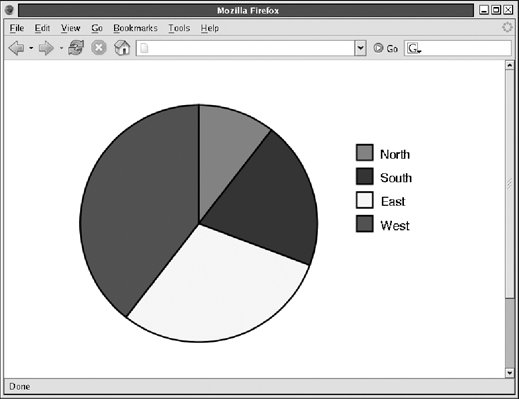 Example 22-8. Drawing a pie chart with JavaScript and SVG
The code in Example 22-8 is relatively straightforward. There is a little math to convert the data being charted into pie-wedge angles. The bulk of the example, however, is DOM code that creates SVG elements and sets attributes on those elements. Note that since SVG uses a namespace, createElementNS( ) is used instead of createElement( ). The namespace constant SVG.ns is defined later in Example 22-9. The most opaque part of this example is the code that draws the actual pie wedges. The tag used to display each wedge is <svg:path>. This SVG element describes arbitrary shapes comprised of lines and curves. The shape description is specified by the d attribute of the <svg:path> tag. The value of this attribute uses a compact grammar of letter codes and numbers that specify coordinates, angles, and other values. The letter M, for example, means "move to" and is followed by X and Y coordinates. The letter L means "line to" and draws a line from the current point to the coordinates that follow it. This example also uses the letter A to draw an arc. This letter is followed by seven numbers describing the arc. The precise details are not important here, but you can look them up in the specification at http://www.w3.org/TR/SVG/. The code in Example 22-8 uses the constant SVG.ns to describe the SVG namespace. This constant and several SVG utility functions are defined in a separate SVG.js file, shown in Example 22-9. Example 22-9. SVG utility code
The most important of the utility functions in the example is SVG.makeCanvas( ). It uses DOM methods to create a new <svg> element that you can then use to draw SVG graphics. makeCanvas( ) allows you to specify both the size (in pixels) at which the SVG graphic is rendered and also the size of the internal coordinate system (or "user space") the drawing uses. (For example: when a drawing that is 1000 x 1000 in user space is rendered into a square that is 250 x 250 pixels, each unit in user space equals one quarter pixel.) makeCanvas( ) creates and returns an <svg> tag, but it does not insert it into the document. The calling code must do that. The other two utility methods in Example 22-9 are used in browsers that display SVG graphics through a plug-in. SVG.makeDataURL( ) serializes the XML text of an <svg> tag and encodes it into a data: URL. SVG.makeObjectTag( ) goes one step further, creating an HTML <object> tag to embed an SVG graphic and then calling SVG.makeDataURL( ) to set the data attribute of that tag. Like SVG.makeCanvas( ), the SVG.makeObjectTag( ) method returns the <object> tag but does not insert it into the document. The SVG.makeObjectTag( ) works in browsers such as Firefox 1.0 that support the data: URL scheme, support namespace-aware DOM methods like document.createElementNS( ), and have an SVG plug-in installed. Note that they do not work in IE because that browser does not support data: URLs or createElementNS( ). In IE, an alternative approach to SVG drawing would be to build the SVG document through string manipulation rather than DOM method calls. The graphic can then be encoded using a javascript: URL instead of a data: URL. I'll conclude this discussion of scripted SVG graphics with the HTML file that ties together the pieChart( ) function of Example 22-8 and the SVG utility methods of Example 22-9. The following code creates an SVG canvas, draws into it, and then inserts it into the document twice: once natively and once via an <object> tag: <script src="/books/2/427/1/html/2/SVG.js"></script> <!-- Utility methods --> <script src="/books/2/427/1/html/2/svgpiechart.js"></script> <!-- Pie chart drawing method --> <script> function init( ) { // Create an <svg> tag to draw into 600x400 resolution, rendered // at 300x200 pixels var canvas = SVG.makeCanvas("canvas", 300, 200, 600, 400); pieChart(canvas, [12, 23, 34, 45], 200, 200, 150, // Canvas, data, size ["red", "blue", "yellow", "green"], // Wedge colors ["North","South","East","West"], 400, 100); // Legend info // Add the graphic directly to the document: document.body.appendChild(canvas); // Embed it with an <object> tag var object = SVG.makeObjectTag(canvas, 300, 200); document.body.appendChild(object); } // Run this function when the document finishes loading window.onload = init; </script> |
EAN: 2147483647
Pages: 767