22.2. Graphics with CSS Cascading Style Sheets (CSS) is described in Chapter 16, where you learned how to script CSS styles to produce DHTML effects. CSS can also produce simple graphics: the background-color property "fills" a rectangle with a solid color, and the border property outlines a rectangle. Furthermore, more specific border properties such as border-left and border-top can be used to draw just a border on one side of a rectangle, which produces horizontal and vertical lines. On browsers that support the styles, these lines can even be dotted or dashed! It's not much, but when combined with absolute positioning, these simple CSS rectangle and line primitives can produce diagrams such as those shown in Figures 22-1 and 22-2. The subsections that follow demonstrate how these figures were generated. Figure 22-1. A bar chart drawn with CSS 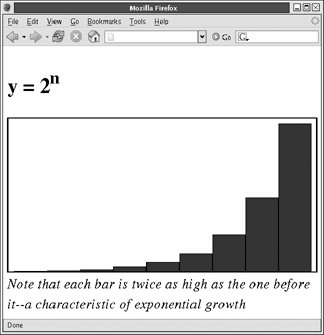
Figure 22-2. A tree drawn with CSS 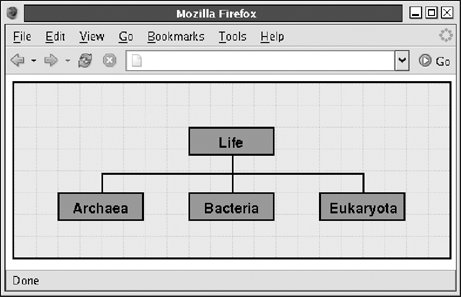
22.2.1. Bar Charts with CSS The bar chart in Figure 22-1 was created with the following HTML file: <!DOCTYPE HTML PUBLIC "-//W3C//DTD HTML 4.01 Transitional//EN" "http://www.w3.org/TR/html4/loose.dtd"> <!-- The drawing won't look right in IE without a doctype like this --> <html> <head> <script src="/books/2/427/1/html/2/BarChart.js"></script> <!-- Include chart library --> <script> function drawChart( ) { var chart = makeBarChart([1,2,4,8,16,32,64,128,256], 600, 300); var container = document.getElementById("chartContainer"); container.appendChild(chart); } </script> </head> <body onload="drawChart( )"> <h2>y = 2<sup>n</sup></h2><!-- Chart title --> <div ><!-- Chart will go here --></div> <!-- chart caption --> <i>Note that each bar is twice as high as the one before ita characteristic of exponential growth</i> </html>
Obviously, the interesting code is the makeBarChart( ) function, defined in the BarChart.js file listed in Example 22-5. Example 22-5. Drawing bar charts with CSS /** * BarChart.js: * This file defines makeBarChart( ), a function that creates a bar chart to * display the numbers from the data[] array. The overall size of the chart * is specified by the optional width and height arguments, which include the * space required for the chart borders and internal padding. The optional * barcolor argument specifies the color of the bars. The function returns the * <div> element it creates, so the caller can further manipulate it by * setting a margin size, for example. The caller must insert the returned * element into the document in order to make the chart visible. **/ function makeBarChart(data, width, height, barcolor) { // Provide default values for the optional arguments if (!width) width = 500; if (!height) height = 350; if (!barcolor) barcolor = "blue"; // The width and height arguments specify the overall size of the // generated chart. We have to subtract the border and padding // sizes from this to get the size of the element we create. width -= 24; // Subtract 10px padding and 2px border left and right height -= 14; // Subtract 10px top padding and 2px top and bottom border // Now create an element to hold the chart. Note that we make the chart // relatively positioned so that it can have absolutely positioned children // but still appear in the normal element flow. var chart = document.createElement("div"); chart.style.position = "relative"; // Set relative positioning chart.style.width = width + "px"; // Set the chart width chart.style.height = height + "px"; // Set the chart height chart.style.border = "solid black 2px"; // Give it a border chart.style.paddingLeft = "10px"; // Add padding on the left chart.style.paddingRight = "10px"; // and on the right chart.style.paddingTop = "10px"; // and on the top chart.style.paddingBottom = "0px"; // but not on the bottom chart.style.backgroundColor = "white"; // Make chart background white // Compute the width of each bar var barwidth = Math.floor(width/data.length); // Find largest number in data[]. Note clever use of Function.apply( ). var maxdata = Math.max.apply(this, data); // The scaling factor for the chart: scale*data[i] gives height of a bar var scale = height/maxdata; // Now loop through the data array and create a bar for each datum for(var i = 0; i < data.length; i++) { var bar = document.createElement("div"); // Create div for bar var barheight = data[i] * scale; // Compute height of bar bar.style.position = "absolute"; // Set bar position and size bar.style.left = (barwidth*i+1+10)+"px"; // Add bar border and chart pad bar.style.top = height-barheight+10+"px";// Add chart padding bar.style.width = (barwidth-2) + "px"; // -2 for the bar border bar.style.height = (barheight-1) + "px"; // -1 for the bar top border bar.style.border = "solid black 1px"; // Bar border style bar.style.backgroundColor = barcolor; // Bar color bar.style.fontSize = "0px"; // IE workaround chart.appendChild(bar); // Add bar to chart } // Finally, return the chart element so the caller can manipulate it return chart; }
|
The code for Example 22-5 is straightforward and fairly simple to understand. It uses the techniques shown in Chapter 15 to create new <div> elements and add them to the document. In addition, it uses the techniques shown in Chapter 16 to set CSS style properties on the elements it creates. No text or other content is involved; the bar chart is simply a bunch of rectangles carefully sized and positioned within another rectangle. CSS border and background-color attributes make the rectangles visible. One critical piece of the code sets the style position:relative on the bar chart itself without setting the top or left styles. This setting allows the chart to remain in the normal document flow but also have children that are absolutely positioned relative to the upper-left corner of the chart. If the chart is not set to relative (or absolute) positioning, none of its bars will be positioned correctly. Example 22-5 includes some simple math that computes the height in pixels of each bar based on the values of the data to be charted. The code that sets the position and size of the chart and of its bars also includes some simple arithmetic to account for the presence of borders and padding. 22.2.2. A CSSDrawing Class The code in Example 22-5 is quite task-specific: it draws bar charts and nothing else. It is also quite possible to use CSS to draw more general diagrams, such as the tree shown in Figure 22-2, as long as they consist of boxes, horizontal lines, and vertical lines. Example 22-6 is a CSSDrawing class that defines a simple API for drawing boxes and lines, and Example 22-7 is code that uses the CSSDrawing class to produce the figure shown in Figure 22-2. Example 22-6. The CSSDrawing class /** * This constructor function creates a div element into which a * CSS-based figure can be drawn. Instance methods are defined to draw * lines and boxes and to insert the figure into the document. * * The constructor may be invoked using two different signatures: * * new CSSDrawing(x, y, width, height, classname, id) * * In this case a <div> is created using position:absolute at the * specified position and size. * * The constructor may also be invoked with only a width and height: * * new CSSDrawing(width, height, classname, id) * * In this case, the created <div> has the specified width and height * and uses position:relative (which is required so that the child * elements used to draw lines and boxes can use absolute positioning). * * In both cases, the classname and id arguments are optional. If specified, * they are used as the value of the class and id attributes of the created * <div> and can be used to associate CSS styles, such as borders with * the figure. */ function CSSDrawing(/* variable arguments, see above */) { // Create and remember the <div> element for the drawing var d = this.div = document.createElement("div"); var next; // Figure out whether we have four numbers or two numbers, sizing and // positioning the div appropriately if (arguments.length >= 4 && typeof arguments[3] == "number") { d.style.position = "absolute"; d.style.left = arguments[0] + "px"; d.style.top = arguments[1] + "px"; d.style.width = arguments[2] + "px"; d.style.height = arguments[3] + "px"; next = 4; } else { d.style.position = "relative"; // This is important d.style.width = arguments[0] + "px"; d.style.height = arguments[1] + "px"; next = 2; } // Set class and id attributes if they were specified. if (arguments[next]) d.className = arguments[next]; if (arguments[next+1]) d.id = arguments[next+1]; } /** * Add a box to the drawing. * * x, y, w, h: specify the position and size of the box. * content: a string of text or HTML that will appear in the box * classname, id: optional class and id values for the box. Useful to * associate styles with the box for color, border, etc. * Returns: The <div> element created to display the box */ CSSDrawing.prototype.box = function(x, y, w, h, content, classname, id) { var d = document.createElement("div"); if (classname) d.className = classname; if (id) d.id = id; d.style.position = "absolute"; d.style.left = x + "px"; d.style.top = y + "px"; d.style.width = w + "px"; d.style.height = h + "px"; d.innerHTML = content; this.div.appendChild(d); return d; }; /** * Add a horizontal line to the drawing. * * x, y, width: specify start position and width of the line * classname, id: optional class and id values for the box. At least one * must be present and must specify a border style which * will be used for the line style, color, and thickness. * Returns: The <div> element created to display the line */ CSSDrawing.prototype.horizontal = function(x, y, width, classname, id) { var d = document.createElement("div"); if (classname) d.className = classname; if (id) d.id = id; d.style.position = "absolute"; d.style.left = x + "px"; d.style.top = y + "px"; d.style.width = width + "px"; d.style.height = 1 + "px"; d.style.borderLeftWidth = d.style.borderRightWidth = d.style.borderBottomWidth = "0px"; this.div.appendChild(d); return d; }; /** * Add a vertical line to the drawing. * See horizontal( ) for details. */ CSSDrawing.prototype.vertical = function(x, y, height, classname, id) { var d = document.createElement("div"); if (classname) d.className = classname; if (id) d.id = id; d.style.position = "absolute"; d.style.left = x + "px"; d.style.top = y + "px"; d.style.width = 1 + "px"; d.style.height = height + "px"; d.style.borderRightWidth = d.style.borderBottomWidth = d.style.borderTopWidth = "0px"; this.div.appendChild(d); return d; }; /** Add the drawing to the document as a child of the specified container */ CSSDrawing.prototype.insert = function(container) { if (typeof container == "string") container = document.getElementById(container); container.appendChild(this.div); } /** Add the drawing to the document by replacing the specified element */ CSSDrawing.prototype.replace = function(elt) { if (typeof elt == "string") elt = document.getElementById(elt); elt.parentNode.replaceChild(this.div, elt); }
|
The CSSDrawing( ) constructor creates a new CSSDrawing object, which is nothing more than a wrapper around a <div> element. The box( ), vertical( ), and horizontal( ) instance methods use CSS to draw boxes, vertical lines, and horizontal lines, respectively. Each method allows you to specify the position and size of the box or line to draw and a class and/or an ID for the box or line element that is created. The class or ID allows you to associate CSS styles with the element to specify colors, line thicknesses, and so on. Creating a CSSDrawing object is not enough to make it visible. Use the insert( ) or replace( ) methods to add it to the document. Example 22-7 shows how the CSSDrawing class might be used. Both the JavaScript code in the drawFigure( ) method and the CSS stylesheet are critical to the figure. The code defines the positions and sizes of the boxes and lines, and the stylesheet defines colors and line thicknesses. Notice that the JavaScript and CSS get entangled, and code in the drawFigure( ) method has to take border widths and padding sizes specified in the stylesheet into account. This is a shortcoming of the drawing API defined by the CSSDrawing class. Example 22-7. Drawing a figure with the CSSDrawing class <!DOCTYPE HTML PUBLIC "-//W3C//DTD HTML 4.01 Transitional//EN" "http://www.w3.org/TR/html4/loose.dtd"> <!-- The drawing won't look right in IE without a doctype like this --> <html> <head> <script src="/books/2/427/1/html/2/CSSDrawing.js"></script> <!-- Include our drawing class --> <style> /* Styles for the figure box itself */ .figure { border: solid black 2px; background-color: #eee;} /* Styles for grid lines */ .grid { border: dotted black 1px; opacity: .1; } /* Styles for boxes in the figure */ .boxstyle { border: solid black 2px; background: #aaa; padding: 2px 10px 2px 10px; font: bold 12pt sans-serif; text-align: center; } /* styles for line connecting the boxes */ .boldline { border: solid black 2px; } </style> <script> // Draw a grid in the specfied rectangle with dx,dy line spacing function drawGrid(drawing, x, y, w, h, dx, dy) { for(var x0 = x; x0 < x +w; x0 += dx) drawing.vertical(x0, y, h, "grid"); for(var y0 = y; y0 < y + h; y0 += dy) drawing.horizontal(x, y0, w, "grid"); } function drawFigure( ) { // Create a new figure var figure = new CSSDrawing(500, 200, "figure"); // Add a grid to the drawing drawGrid(figure, 0, 0, 500, 200, 25, 25); // Draw four boxes in the figure figure.box(200, 50, 75, 25, "Life", "boxstyle"); // top box figure.box(50, 125, 75, 25, "Archaea", "boxstyle"); // line of 3 figure.box(200, 125, 75, 25, "Bacteria", "boxstyle"); // ..boxes below figure.box(350, 125, 75, 25, "Eukaryota", "boxstyle"); // ..the top one // This line is drawn down from the bottom center of the top "Life" box. // The starting y position of this line is 50+25+2+2+2+2 or // y + height + top border + top padding + bottom padding + bottom border // Note that this computation requires knowledge of both the code and // the stylesheet, which is is not ideal. figure.vertical(250, 83, 20, "boldline"); figure.horizontal(100, 103, 300, "boldline"); // line above 3 lower boxes figure.vertical(100, 103, 22, "boldline"); // connect to "archaea" figure.vertical(250, 103, 22, "boldline"); // connect to "bacteria" figure.vertical(400, 103, 22, "boldline"); // connect to "eukaryota" // Now insert the figure into the document, replacing the placeholder figure.replace("placeholder"); } </script> </head> <body onload="drawFigure( )"> <div ></div> </body> </html>
|
|