Hack 38. Map Your Wardriving Expeditions


Found Wi-Fi nearby? Put it on a map!
My interest in Wi-Fi is what got me started with GIS. I had been following the early 802.11 devices and was psyched to read about new modern and cheaply made wireless equipment in the newsand then actually see them on the shelves of various stores. Businesses of all sizes and millions of households started buying and installing these devices all over the place. I wondered where these things were being installed, and just how many were around.
Not long afterwards, I learned that there were people who would go out in their cars with GPSs and laptops, recording the locations of these wireless signals. These wardrivers, I learned, weren't breaking into these networks, but were comparing findings such as the funny names for some of the networks and the locations of the increasingly popular local wireless hotspots. I figured I had to try this out, and after about five minutes, I was hooked.
I was still curious about what my findings looked like. I had to figure out not only how to plot them, but also how to plot them on a map and on the Web. After a while, and with another curious person, Eric Blevins, we put together http://WiFiMaps.com.
WiFiMaps.com is a web-based geographic map of where Wi-Fi has been installed. The locations are updated by the users, who upload their wardriving scans of various areas. In turn, the site uses TIGER, Mapserver, and a host of other open source and otherwise free tools to plot street-level maps of Wi-Fi installations for those who wonder.
You too can do the same thingand not just the wondering part, but also the where part. We'll do some wardriving and use a PHP script to parse the data found, and then plot the Wi-Fi spots on Google Maps.
4.11.1. The Hack
For collecting Wi-Fi data, I generally use Netstumbler, available from http://www.netstumbler.com, which is popular among wardrivers. For free 'nix operating systems, Kismet (http://www.kismetwireless.net/) is the tool of choice, while on Mac OS X, there's both MacStumbler (http://www.macstumbler.com/) and KisMAC (http://kismac.binaervarianz.de). In this hack, we'll be exporting data from these programs in the WiScan log format, which all four programs should happily generate. WiScan is a tab-delimited text file with its own characteristics, and perhaps there are other wardriving packages that also export to this format.
So, go out for a wardrive! If you are in a densely populated area, even a 20-minute wardrive can produce thousands of points. Be safe! Don't be tempted to access any of the networks you find while wardriving unless you have permission from the owner, or you are at a public hotspot. Also, pay attention to the road while collecting datanot your laptop.
4.11.2. The Code
We have four components to mapping the data you've just collected: the HTML form, the plain and simple Google Maps code, the wacky PHP parser bits, and some interesting local data to plot. You'll need access to and permission for a web server with PHP, and to be familiar enough with those to get the code situated.
Let's start with the HTML upload form, which will allow us to send our WiScan log to the server to be mapped. Call this file index.html:
Wi-Fi Data on Google Maps
Send this file:
This is quite simple, and I may have even not included some extra functionality. This seemed to work okay, however. Then we can go to the Google Maps default JavaScript setup described in Chapter 2. I decided to add the large zoom control and the map type control, so you can switch between street maps and satellite imagery.
	Map.addControl(new GLargeMapControl());
	Map.addControl(new GMapTypeControl());
Next is the magical PHP code. We'll keep some sanity here by paring things down by MAC address and doing an average on the various points. This will give us a pseudocenter for placing our markers. We also use a spatial average to generate the starting map. Where you would normally put the following line in your JavaScript:
map.centerAndZoom(new GPoint(-122.141944, 37.441944), 4);
… replace it instead with the PHP code shown here:
	 $unique) {
	 $divlat = $unique["lat"] / $unique["cnt"];
	 $divlng = $unique["lng"] / $unique["cnt"];
	 echo "var point = new GPoint({$divlng}, {$divlat});
";
	 echo "var marker = new GMarker(point);

map.addOverlay(marker);";
	 }

	 }

	?>
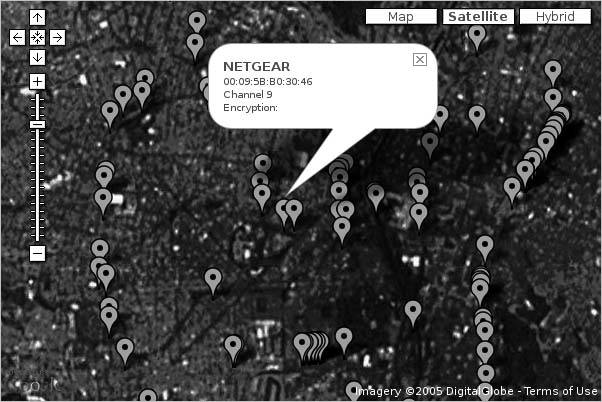
Once you have these scripts in place, you will need to create a temporary directory with appropriate write permissions. You should then be able to call up your PHP script, upload a WiScan file, and have the results displayed on a Google Map, which might look like Figure 4-25.
Figure 4-25. Some results from a wardriving expedition
4.11.3. Hacking the Hack
If you're using Kismet, you can have it generate logfiles in its custom XML format and use a combination of JavaScript and XSLT to translate the log entries directly into HTML for the info window, without the need for PHP. You can see an example of this online at http://mappinghacks.com/projects/gmaps/kismet.html. Since you can view source on that page to see its inner workings, we'll just cover the juicy bits. Here's a somewhat simplified snippet of a Kismet XML log:
	 linksys
	 00:11:22:33:44:55
	 6
	 None

	 6.2069
	 -75.5629
	 6.2078
	 -75.5618
Each wireless-network element in the log contains details about each network seen, including a gps-info element that describes the area in which the network was detected. We can use an XSLT stylesheet to turn each of these entries into HTML:
Channel
Encryption:
The stylesheet identifies a log entry by looking elements in the log called wireless-network, and then outputs an HTML div element, using the values of the SSID, BSSID, channel, and encryption elements from inside each log entry. The HTML that would result from the XSLT transformation of the example log entry using this stylesheet would look something like this:
linksys
00:11:22:33:44:55
Channel 6
Encryption: None
On our map page, we fetch the Kismet log using GXmlHttp and feed it to a function called mapFeed( ). This function uses the JavaScript DOM API to find all the wireless-network entries and then looks inside each one to find the minimum latitude and longitude of the network's coverage area. For each network node with geographic information, a GPoint object is created with its coordinates, which is passed to another function, addMarker( ), to create a marker on the map for that node.
	function mapFeed (xml) {
	 var items = xml.documentElement
	 .getElementsByTagName("wireless-network");

	 map.clearOverlays( );

	 for (var i = 0; i < items.length; i++) {
	 var gpsinfo = items[i].getElementsByTagName("gps-info");
	 if (gpsinfo.length == 0) continue;

	 var lon = gpsinfo[0].getElementsByTagName("min-lon")[0]
	 .childNodes[0].nodeValue;
	 var lat = gpsinfo[0].getElementsByTagName("min-lat")[0]
	 .childNodes[0].nodeValue;
	 var x = parseFloat(lon);
	 var y = parseFloat(lat);
	 if (x && x != 90 && y && y != 180) {
	 var point = new GPoint(x, y);
	 var marker = addMarker(point, items[i]);
	 map.addOverlay(marker);
	 }
	 }
	}
The addMarker( ) function is almost painfully simple:
	function addMarker (point, xml) {
	 var marker = new GMarker(point);
	 GEvent.addListener(marker, "click", function ( ) {
	 marker.openInfoWindowXslt( xml, "kismet2marker.xsl" );
	 });
	 return marker;
	}
The supplied point is used to create a new GMarker, and then a click event is added to that marker, and the marker is returned. Later, when a user clicks on the marker, the event handler calls marker.openInfoWindowXslt( ), which fetches our XSLT stylesheet from the server, applies it to the DOM element containing the log entry for that wireless node, and then takes the resulting HTML and sticks it into a new info window over the marker. The result is quite elegant, because instead of having to assemble the HTML layout of the info window in JavaScript (which can get quite messy), we can use an external XSLT stylesheet to cleanly separate our logic and our presentation. If we want to add other data from the logfiles to the info window, we can do so by updating the XSLT without ever having to touch the JavaScript again.
The JavaScript in this example could stand some improvement. For example, we could fetch the maximum lat/long for each node and average them with the minimum lat/long for a more accurate position. We could also display a different marker based on the contents of the encryption field, so that we could see, at a glance, which networks were open and which were closed. We could add some logic to track the maximum and minimum coordinates of our logfile and set the map center and zoom level appropriately [Hack #58]. Finally, as wardriving logs tend to pick up lots of points quickly, we might want to look into using "Show Lots of StuffQuickly" [Hack #59] as a means of speeding up the map display.
Drew from Zhrodague
You Are Here: Introducing Google Maps
- Hacks 19: Introduction
- Hack 1. Get Around http://maps.google.com
- Hack 2. Find Yourself (and Others) on Google Maps
- Hack 3. Navigate the World in Your Web Browser
- Hack 4. Get the Birds-Eye View
- Hack 5. Driven to a Better User Interface
- Hack 6. Share Google Maps
- Hack 7. Inside Google Maps URLs
- Hack 8. Generate Links to Google Maps in a Spreadsheet
- Hack 9. Use del.icio.us to Keep Up with Google Maps
Introducing the Google Maps API
- Hacks 1016: Introduction
- Hack 10. Add a Google Map to Your Web Site
- Hack 11. Where Did the User Click?
- Hack 12. How Far Is That? Go Beyond Driving Directions
- Hack 13. Create a Route with a Click (or Two)
- Hack 14. Create Custom Map Markers
- Hack 15. Map a Slideshow of Your Travels
- Hack 16. How Big Is the World?
Mashing Up Google Maps
- Hacks 1728: Introduction
- Hack 17. Map the News
- Hack 18. Examine Patterns of Criminal Activity
- Hack 19. Map Local Weather Conditions
- Hack 20. Track Official Storm Reporting
- Hack 21. Track the International Space Station
- Hack 22. Witness the Effects of a Nuclear Explosion
- Hack 23. Find a Place to Live
- Hack 24. Search for Events by Location
- Hack 25. Track Your UPS Packages
- Hack 26. Follow Your Packets Across the Internet
- Hack 27. Add Google Maps to Any Web Site
- Hack 28. How Big Is That, Exactly?
On the Road with Google Maps
- Hacks 2941: Introduction
- Hack 29. Find the Best Gasoline Prices
- Hack 30. Stay Out of Traffic Jams
- Hack 31. Navigate Public Transportation
- Hack 32. Locate a Phone Number
- Hack 33. Why Your Cell Phone Doesnt Work There
- Hack 34. Publish Your Own Hiking Trail Maps
- Hack 35. Load Driving Directions into Your GPS
- Hack 36. Get Driving Directions for More Than Two Locations
- Hack 37. View Your GPS Tracklogs in Google Maps
- Hack 38. Map Your Wardriving Expeditions
- Hack 39. Track Your Every Move with Google Earth
- Hack 40. The Ghost in Google Ride Finder
- Hack 41. How Google Maps Got Me Out of a Traffic Ticket
Google Maps in Words and Pictures
- Hacks 4250: Introduction
- Hack 42. Get More out of What You Read
- Hack 43. Dont Believe Everything You Read on a Map
- Hack 44. You Got Your A9 Local in My Google Maps!
- Hack 45. Share Pictures with Your Community
- Hack 46. Browse Photography by Shooting Location
- Hack 47. Geotag Your Own Photos on Flickr
- Hack 48. Tell Your Communitys Story
- Hack 49. Generate Geocoded RSS from Any Google Map
- Hack 50. Geoblog with Google Maps in Thingster
API Tips and Tricks
- Hacks 5161: Introduction
- Hack 51. Make a Fullscreen Map the Right Way
- Hack 52. Put a Map and HTML into Your Info Windows
- Hack 53. Add Flash Applets to Your Google Maps
- Hack 54. Add a Nicer Info Window to Your Map with TLabel
- Hack 55. Put Photographs on Your Google Maps
- Hack 56. Pin Your Own Maps to Google Maps with TPhoto
- Hack 57. Do a Local Zoom with GxMagnifier
- Hack 58. Find the Right Zoom Level
- Hack 59. Show Lots of StuffQuickly
- Hack 60. Make Things Happen When the Map Moves
- Hack 61. Use the Right Developers Key Automatically
Extreme Google Maps Hacks
- Hacks 6270: Introduction
- Hack 62. Find the Latitude and Longitude of a Street Address
- Hack 63. Read and Write Markers from a MySQL Database
- Hack 64. Build Custom Icons on the Fly
- Hack 65. Add More Imagery with a WMS Interface
- Hack 66. Add Your Own Custom Map
- Hack 67. Serve Custom Map Imagery
- Hack 68. Automatically Cut and Name Custom Map Tiles
- Hack 69. Cluster Markers at High Zoom Levels
- Hack 70. Will the Kids Barf? (and Other Cool Ways to Use Google Maps)
EAN: 2147483647
Pages: 131
