Debugging
| When you're compiling code in the default Debug mode, the compiler includes several options that may be used in order to assist you during the process of debugging an application. These options include stepping through the code, using code breakpoints, using conditional debugging when an exception is thrown, using process monitoring, and analyzing the program state using the .NET debugging tools.
Stepping Through Code During ExecutionOne method used in debugging an application is the step-by-step execution of its code within the debugger. If the application terminates unexpectedly, you will have a good idea of where in the application the problem lies. You may also check for variable values and other ongoing changes being made by the code during its execution so that you may determine the effect each step has produced. Visual Studio .NET supports three ways to step through an application while you're debugging it. You can use the keyboard shortcuts shown in Table 12.5 to select the action to perform. Note that the shortcuts shown are for the Visual Basic keyboard mapping; your copy of Visual Studio .NET may use a different mapping. You can check your keyboard mapping by selecting My Profile from the Visual Studio .NET Start Page. Table 12.5. Options for Step-by-Step Application Execution
Using BreakpointsA breakpoint causes code execution to pause when encountered . If you place a breakpoint in your code, the application will pause when it reaches that point, allowing you to do the following:
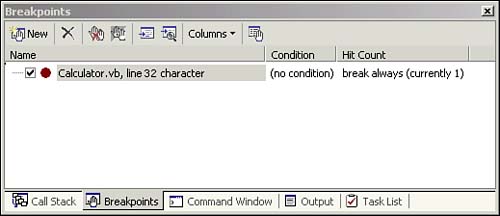
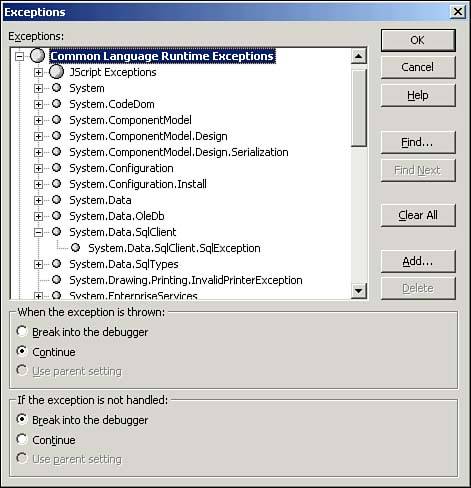
Within the Visual Studio .NET IDE, you may add a breakpoint by right-clicking the beginning of a line of code and selecting Add Breakpoint from the options provided. The New Breakpoints dialog box includes options for creating a breakpoint within a file, function, or address within the code as well as when a specific condition is met. You may right-click an existing breakpoint to remove or disable the breakpoint's operation. Removing a breakpoint also removes any information you have associated with it using the Breakpoints window, whereas disabling a breakpoint simply causes the debugger to ignore it and continue normally. You can open the Breakpoints window, shown in Figure 12.2, by selecting Debug, Windows , Breakpoints from the header. Figure 12.2. The Breakpoints window showing a breakpoint set on the 32nd line of code within the Calculator application. Debugging When an Exception Is ThrownYou can configure the debugger to respond when a particular exception is thrown by using the Exceptions dialog box shown in Figure 12.3. Here, you can configure the debugger to continue or break execution when an exception is thrown or when an unhandled exception occurs, alerting you to the presence of an unhandled exception within your code. Figure 12.3. The Exceptions dialog box allows you to decide whether to break into the debugger when an exception is thrown or if it is not handled. Debugging a Running ProcessYou can configure debugging for a running process on a local or remote system running the Machine Debug Manager ( mdm.exe ) service. This service is loaded with Visual Studio .NET or through the Remote Components Setup Wizard included with Visual Studio .NET. After instantiating the process, open the Processes dialog box through Debug, Processes or Tools, Debug Processes within the header of the Visual Studio IDE. Select the target system and a running process within the Processes dialog box. Then click the Attach button. You are now able to attach the Common Language Runtime (CLR) to add the process to your selected " debugged processes." If you want to debug a DLL file rather than an EXE file, you will need to create a simple application that invokes the DLL and then attach to the invoking application's process. Analyzing Program StateDuring the debugging process, you will want to be able to evaluate many conditions and values that changed while the program was running. The Visual Studio .NET development environment includes several windows that provide you with this information. You will find several useful windows in the Debug, Windows menu:
|
EAN: N/A
Pages: 188