Using Event Monitoring Tools
| I l @ ve RuBoard |
| This section covers various event monitors that are available for monitoring system resources. You can configure event monitors to generate a message when a change in status occurs or when a predefined threshold condition is met. This is different from commands, which give you status reports only when asked, and performance monitoring, which is generally studied over a long period of time. Event monitors generate a notification message soon after faults and events occur. Event Monitoring ServiceSeveral monitors discussed in this section are integrated into the Event Monitoring Service (EMS) framework. The EMS framework, available only on HP-UX systems, enables monitors to be provided in a consistent manner for a system. Although the EMS framework itself is freely available, some monitors are delivered with HP-UX Online Diagnostics, some are sold separately, and others are bundled with the individual products for which they provide monitoring. EMS provides a consistent GUI for the discovery and configuration of resources that can be monitored . Using EMS, you can define conditions that indicate when notification events should be sent, which can be at periodic intervals, when a component's state changes, or when a threshold condition is met. EMS also enables you to configure where events should be sent. You can configure EMS to send events to OpenView IT/O, directly to any SNMP-capable manage ment station, to a network application listening on a TCP or UDP port, to an e-mail address, or locally to the console, system log file, or a regular log file. Furthermore, you can configure MC/ServiceGuard to make packages dependent on these EMS resources. EMS monitors provide help primarily with fault and resource management. Performance monitoring generally requires more sophisticated tools. Some system fault and resource monitoring capabilities are provided by the EMS HA Monitors product, discussed in the next section. Other EMS monitors allow you to detect when you are getting low on system resources, such as file descriptors, shared memory, and system semaphores. Templates for formatting EMS SNMP traps into various enterprise management platform Event Browsers, including OpenView, CA Unicenter, and other freely available EMS tools, are available to download from the Internet at http://www.software.hp.com, under the High Availability Software product category. A developer's kit is also available so that customers and system management software providers can integrate their own EMS monitors. EMS manuals are available at http://docs.hp.com/unix/ha. EMS High Availability MonitorsThe HA Monitors product contains several EMS monitors for monitoring filesystem space, network interface status, disk status, and MC/ServiceGuard cluster status. HA Monitors also detects changes in the number of users and jobs. This product has been extended to include database monitoring capabilities as well. Available filesystem space can be monitored for any mounted filesystem. The operational status is monitored for each configured network device. For disks, you can monitor physical volume status, logical volume status, the number of mirrored copies, and summary information. The MC/ServiceGuard cluster monitor, included with HA Monitors, reports on cluster events, such as the failure of a cluster node, and provides monitoring that is similar to the events reported in ClusterView. The ClusterView product provides more complete monitoring of MC/ServiceGuard clusters, but it requires the purchase of HP OpenView. Here are the resources monitored by the cluster monitor:
Monitoring node status using EMS can be done to provide notification when MC/ServiceGuard detects problems with the system. Whereas MC/ServiceGuard's job is to detect a system failure and move the configured application package(s) to an alternate system, the EMS cluster monitor's job is to notify you of such an event. EMS Hardware MonitorsThe EMS Hardware Monitors provide the ability to detect and report problems with system hardware resources, including system memory, tape devices such as SCSI, Digital Linear Tape (DLT), and Digital Data Storage (DDS), tape libraries, and autoloaders. These monitors detect device errors, component failures, page deallocation errors, and other faults. They poll the hardware at regular intervals and most notify of hardware errors in real time. These monitors are delivered with HP-UX Online Diagnostics, which are freely available for HP-UX. The EMS Hardware Monitors provide monitoring for the following system components and Hewlett-Packard products:
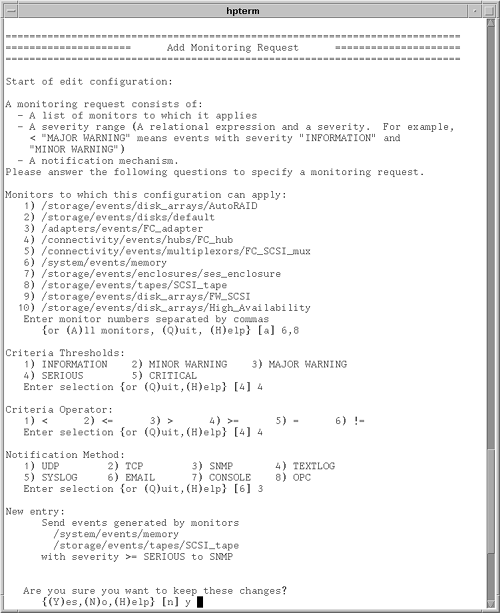
These EMS Hardware Monitors are designed to provide consistency in the configuration interface, event detection, and message formats that provide a detailed description of a problem and a recommended recovery action. The EMS Hardware Monitors can report low-level device errors that are encountered during an I/O session with a device. They detect and report component and Field Replaceable Unit (FRU) failures, including fan and power supply problems. Protocol errors are also detected . For monitoring tape devices, events include problems reading or writing data, bad tapes, wrong tapes, temperature problems, tape loader errors, tape changer problems, and incorrect firmware. For monitoring system memory, the monitor checks the page deallocation table and reports an event when the table is 60, 90, or 100 percent full. This indicates that a new memory SIMM (Single In-line Memory Module) should be added to replace a failed memory chip. These threshold values are configurable. The monitor assigns hardware events severity levels, which reflect the potential impact of an event on system operation. Table 4-3 provides a description of each severity level. EMS Hardware Monitor configuration is done by using the Hardware Monitoring Request Manager. Notification conditions can be configured in a consistent way for all supported hardware resources on the system. As hardware is added to the system, monitoring can be enabled automatically. Figure 4-3 shows an example of using the Hardware Monitoring Request Manager to send SNMP traps of all critical and serious tape and memory events. To configure with MC/ServiceGuard, you need to use the MC/ServiceGuard configuration interface. Figure 4-3. Configuring EMS Hardware Monitors using the Hardware Monitoring Request Manager. The EMS Hardware Monitors provide fault information only. No performance- related events are included. When an EMS Hardware Monitor detects an event, a notification message is sent to the designated target locations. The message contains a full description, including the system on which the event occurred, the date and time when the event was detected, the hardware device on which the event occurred, a description of the problem, the probable cause, and recommended action. The event message contains detailed information, including product/device identification information, I/O log event information, raw hardware status, SCSI status, and more. Table 4-3. Description of Hardware Event Severity
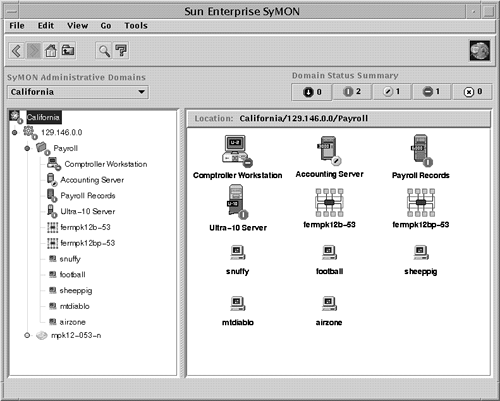
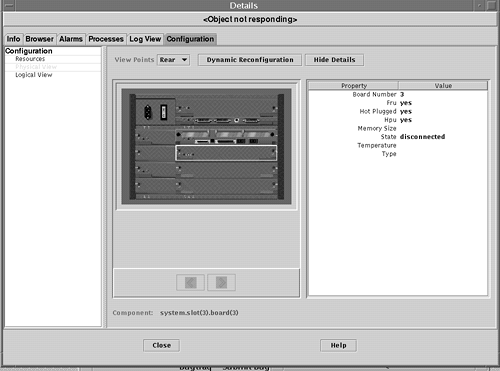
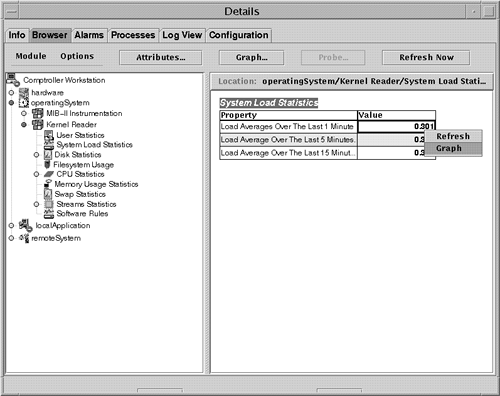
Most EMS Hardware Monitors are "stateless." In other words, events of the designated severity are forwarded as soon as they are detected; no aspect of history or correlation with other data is involved, except that the monitor limits repeated messages by using a repeat frequency. Determining the current status of a device is difficult, because messages are sent only when an event occurs. To monitor for hardware device state changes, you can use a Peripheral Status Monitor (PSM), which maintains the state of monitored hardware devices and reports state changes. The PSM gathers events from the other EMS Hardware Monitors, but does not send its own notification unless a state change has occurred. By default, critical or serious events cause the PSM to change a device's status to Down. For example, critical tape events from a tape monitor would cause the PSM to change the device's status to Down. The PSM would then send a single "Tape device status = Down" event if the administrator had requested to be notified of such an event. This may be the only message visible to the administrator. Additional disk failure messages would not be forwarded because they are not the result of a status change (in other words, the status remains Down). This reduces the number of events that need to be processed by the user . The last event received should reflect the current device status. Most monitors cannot automatically detect when a device has been fixed. When a problem is solved , the set_fixed command must be used manually to alert the PSM to reset the device status to Up. When using an enterprise management tool, such as IT/O, which receives messages from multiple systems, you should use the PSM to reduce information overload. However, make sure that the stateless events are also configured to go somewhere (such as the system log file), because they provide valuable diagnostic information when a component has failed. Monitoring hardware device status is done through the EMS Configuration GUI. You can learn more about Hewlett-Packard's diagnostic tools on its Web site at http://docs.hp.com/hpux/systems/. Enterprise SyMONSun's Enterprise SyMON is a system management platform for monitoring and managing the Sun systems in your enterprise. Enterprise SyMON provides administrators the capability to manage all of their Sun systems remotely from a common interface. Enterprise SyMON can automatically discover the Sun systems in the environment. Intelligent SyMON agents run on each system, to provide monitoring and remote management capabilities. The console layer of Enterprise SyMON provides a visual representation of all managed objects. The console layer provides several views of the enterprise, including logical views and topological views. The Logical View window provides a hierarchical representation of the systems being managed. Indicators are used on system icons to indicate the alarm status of the system. As shown in Figure 4-4, you can see the status of the systems in the payroll domain. Badges on each system icon indicate the alarms for the node. The Domain Status Summary at the top of the window shows how many alarms are outstanding in each category. Figure 4-4 shows no down alarms, two critical alarms, one alert, one caution, and no disabled. So, Comptroller Workstation has a caution-level alarm outstanding. Figure 4-4. Viewing the status of systems in the payroll domain from the SyMON console. When a critical event occurs, such as a hardware component failure, it is indicated in the Logical View window. As the event occurs, the failed hardware component is also highlighted in the Physical View window. You can use this photo-like view of the system to detect and isolate failed or failing components. As shown in Figure 4-5, the Physical View indicates that board 3 is disconnected, and highlights the back panel of the server to show you where the board is. Figure 4-5. Using the SyMON Physical View to identify a failed hardware component. Enterprise SyMON provides event and alarm management. Alarms and actions can be configured so that events are sent via SNMP traps to the SyMON console when certain conditions or thresholds are met. Event-based actions and notifications, such as e-mail, can also be configured. Recovery actions can be associated with an event. Additional events can be defined and generated by placing rules written in the TCL scripting language in a special directory. SyMON provides features for correlating events and filtering based on priority and severity. SyMON provides intelligent agents, which run on the systems being monitored. The agents are configured with intelligence to detect abnormal conditions, to generate alarms based on default or customized thresholds, and to perform actions automatically, based on certain predefined events. The agent architecture consists of several modules. For example, the Config-Reader module is responsible for monitoring all hardware components. The agents are extensible such that new mod ules can be dynamically loaded from the console without disrupting service. If you don't need certain modules, you can save resources by unloading them. A browser window, shown in Figure 4-6, shows the different statistics that can be monitored on the left panel. The panel in the right shows current System Load Statistics. Many of the resources available to be monitored are mentioned in this section. Figure 4-6. The SyMON Browser showing the various system resources that can be monitored. The Hardware Config-Reader module provides configuration management by tracking the hardware and firmware configured on the system, down to the serial number. This information is used to create logical and physical views. The SyMON agent provides hardware fault monitoring, as well as predictive failure analysis for memory and disks. The Config-Reader module monitors hardware and alerts you at the console when a problem exists. If it is a predicted memory failure, you can configure actions to do a dynamic reconfiguration to remove the bad memory. The Config-Reader reports on many hardware faults, including temperature problems and power supply status. It monitors CPU and memory board status, controllers, I/O devices, and tape devices. For the operating system, the agent includes modules to monitor CPU utilization, memory usage, directory size, file size and file modification time, MIB-II objects, NFS activity, inode usage, swap statistics, filesystem usage, and disk rates and service times. A file-scanning mod ule also is available that can be used to check log files, such as the system log, for errors or specific patterns. The Health Monitor uses rules based mostly on performance metrics to correlate the metrics to detect when alarm conditions exist. It sends an alarm when alarm conditions occur, along with suggested steps on how to improve system performance. The Health Monitor has rules to detect swap space conditions, kernel contention , CPU, disk, or memory bottlenecks, printer problems, and filesystem conditions. SyMON agents provide active management, including active configuration management controls for dynamic reconfiguration, system domain management, and an "alternate pathing" feature for redirecting disk I/O in the event of a controller failure. With this capability, administrators can take care of repairs , such as replacing a failed memory board, without a service interruption. Sun Enterprise Servers Models E3000 through UE10000, with Solaris 2.6 or greater, support dynamic reconfiguration. This feature enables you to replace boards online without taking down the system. You can have backup boards on standby and available for immediate use. Or, if a CPU or memory board fails, you can unconfigure and disconnect the failed board online via SyMON, replace the board, and then connect and configure the new board, making the resource available to the system without a reboot. This feature is also available for hot-pluggable disk devices. As previously described, SyMON can help you with configuration, fault, and resource monitoring on your system. However, SyMON is available only for monitoring Sun systems. OpenView IT/OperationsIT/Operations (IT/O) is an OpenView application providing central operations and problem management. NNM is included as part of the IT/O product. IT/O uses intelligent agents that run on each managed system to collect management information, messages, and alerts, and send the information to a centralized console. After receiving events, IT/O can initiate automatic corrective actions. When an operator reads an individual message, guidance is given and actions may be suggested for further problem resolution or recovery. IT/O comes with predefined monitors and templates, including monitors for e-mail, CPU utilization, and swap utilization, among other things. Using log file templates allows you to monitor system log files for system errors, switch user events, logins, logouts, and kernel messages. IT/O enables you to define and customize your own monitors and templates so that you can monitor arbitrary MIB variables , such as the system uptime MIB variable mentioned earlier in this chapter. IT/O periodically queries the MIB object to determine whether or not a message should be generated. You can write a program or script that can be periodically invoked by an IT/O agent, and you can modify templates and message conditions so that an operator is paged under certain conditions. Many other tools plug in to IT/O to provide additional monitoring and management capabilities. IT/O is useful when an operator needs to manage numerous systems consistently. Templates can be modified and then downloaded to a set of systems, enabling multiple systems to be monitored identically. This way, monitoring can be set up in a consistent way for all systems. IT/O has four main windows :
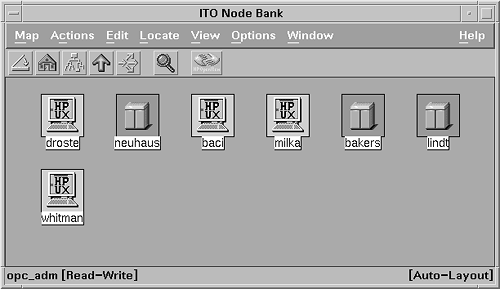
You can see an example of the Node Bank window in Figure 4-7. In this window, the node color reflects the color of the most critical event that has been received but not yet acknowledged . Figure 4-7. IT/O Node Bank window showing node status. The Message Browser can filter out messages from systems that you don't care about. If you are responsible for only a specific system function, such as performance, you can configure the Message Browser to show only those messages from a specific message group . The IT/O Application Bank provides some other tools to monitor your system, and it also provides remote access tools to diagnose problems further. From the Application Bank, you can bring up a telnet window or, for HP-UX systems, run SAM on the system having problems. You can run PerfView or GlancePlus (discussed later in this chapter), check the print status, or check the CPU load on any UNIX system. As previously described, IT/O provides assistance with multiple aspects of system monitoring, especially faults, and resource and performance management. IT/O can also help with security monitoring, with its predefined template for monitoring root login attempts. GlancePlus Pak 2000Hewlett-Packard also includes a preconfigured, single-system version of IT/O with its GlancePlus Pak 2000 product. In addition to displaying performance data, the product includes a Java-based GUI that presents diagnostic applications and an Event Browser. The product enables you to connect to information from multiple systems, as long as you connect to one system at a time. GlancePlus Pak 2000 includes the intelligent agent technology from its enterprise version, enabling it to collect events from a variety of sources and execute automated actions. After events are received in the Event Browser, an operator can trigger some predefined recovery actions. |
| I l @ ve RuBoard |
EAN: 2147483647
Pages: 90
