UMDF Walkthrough: Debugging the Fx2_Driver Sample
This section shows how to use WinDbg with the Fx2_Driver sample. The sample has no known bugs, but using WinDbg to walk through the source code is a convenient way to demonstrate how to use WinDbg with UMDF drivers.
This walkthrough can be done on the same computer on which the driver was developed, but this walkthrough assumes a dedicated test computer. This example was created on a computer running a checked build of Fx2_Driver on a free build of Windows Vista, but it will work much the same way on Windows XP.
Prepare to Debug Fx2_Driver
These steps apply to the information presented in "How to Prepare for UMDF Debugging" earlier in this chapter.
To Prepare for the Debugging Session
-
Build the driver and install it on the test computer.
-
Copy the driver's source code and symbol files to a convenient folder on the test computer.
-
Prepare the test computer for UMDF debugging as described earlier in this chapter.
| Tip | The first time you try this technique, set the HostProcessDbgBreakOnStart value to a large value, such as 60 (0x3C) or even 120 (0x78), to give yourself plenty of time to attach WinDbg to WUDFHost. |
Start the Debug Session for Fx2_Driver
This walkthrough starts with the driver load and startup code.
To Start the Debugging Session
-
Open a command window.
-
Type the following command and press the spacebar-but do not press Enter:
-
WinDbg -p
-
-
Run Task Manager and, on the Processes tab, click the Image Name header control to put the WUDFHost instances near the top.
-
Insert the Fx2 device into one of the computer's USB ports and wait until a new instance of WUDFHost appears in Task Manager.
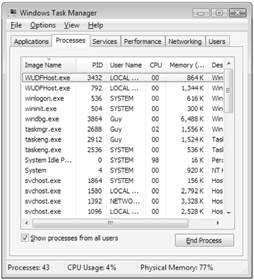
Figure 22-2 shows an example with two instances of WUDFHost in Task Manager. The upper one hosts the driver in this example.
-
Append the device's PID to the command string that you started in Step 2, and then press ENTER to start WinDbg and attach it to WUDFHost.
You must do this step within the time delay that you assigned to HostProcessDbgBreakOnStart.

Figure 22-2: Task Manager displaying WUDFHost processes
In the example shown in Figure 22-2, the WUDFHost PID for Fx2_Driver is 3432.
Examine the OnDeviceAdd Callback Routine for Fx2_Driver
A convenient place to start debugging the startup code is the driver's CMyDriver:: OnDeviceAdd method.
To Load the Symbols and Source Code
-
Set the source and symbol paths to include the driver's source code and symbol file folders, respectively.
-
Run the lm debugger command to verify that you have the correct driver and UMDF symbols.
-
On the WinDbg File menu, click Open Source File.
-
In the Open Source File dialog box, open Driver.cpp and Device.cpp. This opens two new source file windows.
Driver.cpp and Device.cpp contain the source code for the driver callback object and the device callback object, respectively.
To Start Debugging the Fx2_Driver Startup Code
-
In the WinDbg Command window, enter the bu command to set a deferred breakpoint at the start of CMyDriver::OnDeviceAdd, as follows:
-
bu CMyDriver::OnDeviceAdd
-
-
In the WinDbg Command window, enter the g command to start the driver.
When the driver reaches the breakpoint, WinDbg highlights the opening brace of CMyDriver::OnDeviceAdd in the source window.
-
Step through the code until you reach the following line:
hr = CMyDevice::CreateInstance(FxWdfDriver, FxDeviceInit, &device);
The simplest way to do this is with the toolbar button. You can also use the p command, which provides some additional features beyond executing the current line.
-
Step past that line, which creates the device object.
The device object is one of the key UMDF objects. WinDbg can provide information about the object and its current state.
To Display Information About the Device Object and its Current State
-
In WinDbg, open a Locals window.
-
Expand the device node.
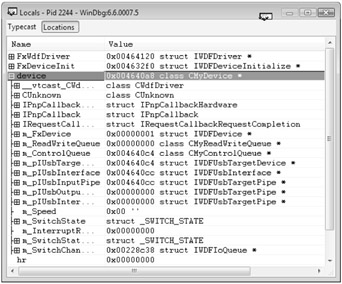
This displays the contents of the device object, including the interfaces that it exposes and the values of its data members, as shown in Figure 22-3. Note that some of the data members have not yet had values assigned to them. Much of that takes place later, in the CMyDevice:: OnPrepareHardware routine.

Figure 22-3: WinDbg Locals window for CMyDevice--CreateInstance
Use UMDF Debugger Extensions to Examine the Device Callback Object
The WinDbg UI can provide only a limited amount of information about the device object. The UMDF debugger extensions are often the most useful tools because they can provide detailed information on UMDF-specific issues.
To Use UMDF Debugger Extensions to Examine the Device Object
-
If you have not already done so, use the .load command to load the UMDF debugger extensions, as shown in the following example:
-
.load %wdk%\bin\wudfext.dll
Replace %wdk% with the appropriate path for the WDK on your system.
-
-
Set a breakpoint in the driver's CMyDevice::OnPrepareHardware method, as follows:
-
bp CMyDevice::OnPrepareHardware
-
-
Run the g command to run the driver to the breakpoint.
This places the debugger at the beginning of CMyDevice::OnPrepareHardware. You can also use the techniques in this section to examine the device object in CMyDevice::OnDeviceAdd, but there's more to see in CMyDevice::OnPrepareHardware.
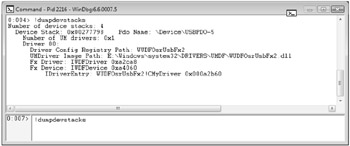
The !dumpdevstacks UMDF debugger extension displays information about the device stack in the current host process. Figure 22-4 shows an example of the the !dumpdevstacks command for Fx2_Driver.

Figure 22-4: Output from the !dumpdevstacks debugger extension
Use UMDF Debugger Extensions to Examine an I/O Request
You can use WinDbg to see exactly how an I/O request is handled.
To See How the Driver Handles I/O
-
Set a breakpoint in the driver's CMyControlQueue::OnDeviceIoControl callback routine.
The method is located in ControlQueue.cpp. Device I/O control requests are used to control several aspects of the device, including the light bar.
-
Run the g command to restart the driver.
-
Start the Osrusbfx2 test application, and use it to turn on one or more of the lights on the light bar.
The framework calls CMyControlQueue::OnDeviceIoControl to deliver the request to the driver and breaks into the debugger at the start of the routine.
-
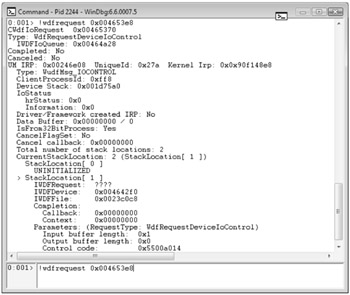
To examine the incoming request object, run the !wdfrequest debugger extension.
The first part of Figure 22-5 shows the output of the !wdfrequest command with Fx2_Driver.

Figure 22-5: Output from the !wdfrequest debugger extension for Fx2_Driver
See "More Suggestions for Experimenting with WinDbg" at the end of this chapter for more ideas on how to use WinDbg to debug WDF drivers.
EAN: 2147483647
Pages: 224