Lesson 2: Working with SQL Server
The rest of this book describes how you will manage and administer SQL Server. You will use SQL Server Enterprise Manager and SQL Server Query Analyzer for most administrative tasks. This lesson introduces these two important tools.
After this lesson, you will be able to
- Describe SQL Server implementation and administration activities
- Describe how client/server tools are used to administer SQL Server
- Use SQL Server Enterprise Manager
- Use SQL Server Query Analyzer
Estimated lesson time: 60 minutes
SQL Server Activities
SQL Server activities generally fall into one of two categories: implementing a SQL Server database, which is often the job of a developer, and administering a SQL Server database. This section lists some of the tasks involved in each of these categories. The focus of this book is on administering a SQL Server database.
Implementing a SQL Server Database
Implementing a SQL Server database means planning, creating, and maintaining a number of interrelated components.
The nature and complexity of a database application, as well as the process of planning it, can vary greatly. For example, a database can be relatively simple, designed for use by a single person, or it can be large and complex, designed to handle all the banking transactions for hundreds of thousands of clients.
Regardless of the size and complexity of the database, implementing a database usually involves
- Designing the database so that your application uses hardware optimally and allows for future growth, identifying and modeling database objects and application logic, and specifying the types of information for each object and the types of relationships between objects.
- Creating the database and database objects, including tables, data integrity mechanisms, data entry and retrieval objects (often stored procedures), appropriate indexes, and security.
- Designing a database for performance. You want to ensure that the database performs important functions correctly and quickly. In conjunction with correct database design, the correct use of indexes, RAID, and filegroups is essential to achieving good performance.
- Planning deployment, which includes analyzing the workload and recommending an optimal index configuration for your SQL Server database.
- Administering the application after deployment, which includes configuring servers and clients; monitoring server performance; managing jobs, alerts, and operators; managing security; and managing database backup procedures.
This book does not cover these database implementation activities.
Administering a SQL Server Database
Administering a SQL Server database involves
- Installing and configuring SQL Server and establishing network security.
- Upgrading to new versions of SQL Server.
- Building databases, including allocating disk space to the database and the transaction log and the ongoing management of disk space usage.
- Transferring data into and out of databases.
- Planning and implementing a backup and restore strategy.
- Defining and implementing database user and application security.
- Automating jobs for repetitive tasks and alerts for reporting errors.
- Monitoring and tuning databases and the server.
- Setting up replication to publish data to multiple sites.
Client/Server Tools
All of the SQL Server administrative tools are clients. They connect to the SQL Server service (MSSQLServer) just as user applications do. This is always true, whether the administrative tools are running on the SQL Server computer or on another computer on a network. The SQL Server service takes a number of startup parameters. Other than these startup parameters, the only way to interact with the SQL Server service is by making a client connection and sending Transact-SQL commands. None of the tools interact directly with the database files.
The server has to be running for the tools to connect. If the server is not running, most of the administrative tools will show an error message; Enterprise Manager, however, can automatically start the server. When Enterprise Manager connects to the server, it uses the security settings saved in the server registration, so you are not prompted to log on. As you use the graphical interface, Enterprise Manager uses Transact-SQL and the SQL-DMO interface to communicate with the server.
Some database operations require that no other user be using the database when you perform the operation. As far as the server is concerned, each connection is completely independent, so it is possible for tools running on the same computer to interfere with each other. If you have Enterprise Manager and Query Analyzer open at the same time, you have at least two connections to SQL Server (more if you have more than one query window open in Query Analyzer). For example, if Query Analyzer is using a database and you try to perform an exclusive operation on that database with Enterprise Manager, the Query Analyzer connection will prevent the Enterprise Manager connection from gaining exclusive access to the database, and the operation will fail.
We will focus on the Enterprise Manager and the Query Analyzer in this section. Other client utilities available with SQL Server include the SQL Server Client Configuration tool, SQL Server Performance Monitor, SQL Server Profiler, SQL Server Setup, and SQL Server wizards.
SQL Server Enterprise Manager
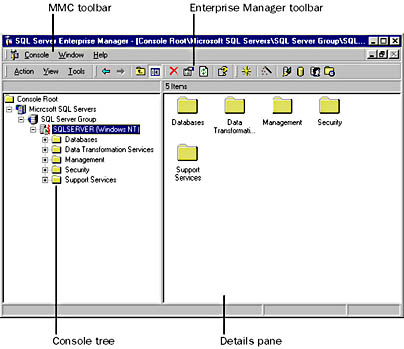
Enterprise Manager is a server administration and database management client. It is a Microsoft Management Console (MMC) snap-in. MMC is a shared user interface for BackOffice server management that provides a convenient and consistent environment for administrative tools. One or more snap-ins are loaded and configured in MMC to create a console. Enterprise Manager is a preconfigured MMC console. It is possible to configure your own consoles that include other BackOffice or third-party snap-ins. The main parts of the Enterprise Manager window, shown in Figure 4.2, are as follows:

Figure 4.2 The main parts of the Enterprise Manager window
- MMC toolbar—This toolbar is not used by Enterprise Manager; you use it to manage consoles if you have other administrative tools open in MMC.
- Enterprise Manager toolbar—This toolbar, which is part of the console window, is where you will find the SQL Server Enterprise Manager tools. There are three menus and a number of icons on the toolbar:
- Action menu: A context-sensitive list of actions for the currently selected item in the console tree.
- View menu: A list of views that you can select for the details pane. Also allows you to hide or display various windows and window components.
- Tools menu: A list of administrative tools and wizards that can be launched from Enterprise Manager. Some of these are part of Enterprise Manager; others are separate tools that are provided here for convenience.
- Console tree—The console tree presents a hierarchical tree of folders and lists of icons that you use to navigate the administrative components of SQL Server. If there is a + next to the item, you can click the + to expand the detail for that item. Right-click an item for a pop-up menu of operations for that item. Click an item to see the detail for that item in the details pane.
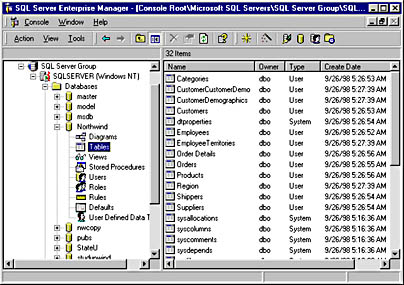
- Details pane—This pane displays details for the currently selected item in the console tree. You can view the details as a set of large or small icons, a list of icons, or a detail list, much the same as the file list in Windows Explorer. Figure 4.3 shows a detail list view for a database.

Figure 4.3 The detail list view for a database
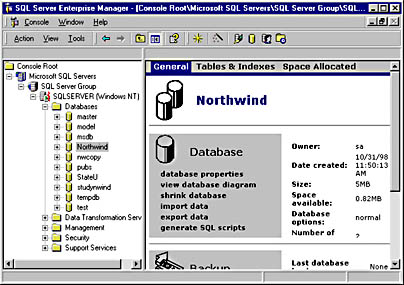
For a number of items that you select in the console tree, you can also view a taskpad in the details pane. A taskpad may present tasks related to the selected item or a summary report containing useful information and statistics about a SQL Server component. To switch between one of the icon views and the taskpad view, right-click the item in the console tree, point to View, and then click Taskpad. If there is no Taskpad option on the View menu, it means that there is no taskpad for that item. Taskpads are HTML pages, which may have links that you can click in the same way that you click a link on a Web page in your browser. For this reason, when you right-click in a taskpad, you will see the Internet Explorer pop-up menu, not the Enterprise Manager pop-up menu that you see when viewing one of the item views. Figure 4.4 shows the taskpad for a database.

Figure 4.4 The taskpad for a database
You often need to refresh views in Enterprise Manager to see the most up-to-date server information, especially if you execute Transact-SQL commands in Query Analyzer or other tools. Right-click an item in the console tree and click Refresh to refresh that item. If you want to quickly refresh everything, right-click your server and click Disconnect. When you expand your server again, Enterprise Manager makes a new connection to the server and retrieves fresh copies of all items. Note that the presence of a red zigzag line next to the server icon in the console tree indicates that you are connected to the server.
NOTE
In previous versions of SQL Server, Enterprise Manager had a query window in which you could execute interactive queries. Although Enterprise Manager no longer has its own query window, you can now launch Query Analyzer from the Tools menu to execute interactive queries.
Exercise: Using Enterprise Manager
In this exercise you will explore the main features of the Enterprise Manager interface to familiarize yourself with Enterprise Manager in preparation for the exercises in the rest of the book.
- To explore some of the features of the Enterprise Manager interface
- Open Enterprise Manager.
- Expand SQL Server Group, then expand your server.
- Click your server in the console tree.
- Right-click your server in the console tree, point to View, and click Taskpad.
- Expand your server, expand Databases, and click the Northwind database.
- Right-click the Northwind database, point to View, and click Taskpad.
- Review the information about the Northwind database.
- Click the Tables & Indexes link to see information about the size of the tables and indexes in the Northwind database.
- Expand Northwind, and click Tables.
- In the details pane, right-click the Products table, point to Open Table, and click Return All Rows.
- On the Tools menu, click SQL Server Configuration Properties. (You may need to close the table view before accessing the Tools menu.)
- Click the various tabs in the SQL Server Properties dialog box and review the properties for your server. Do not change any of the default values.
- Click Cancel to close the SQL Server Properties dialog box without saving changes.
Large icons are listed for the administrative folders on your server.
The taskpad for your server is shown. Try clicking on some of the links in the taskpad, and notice that each one takes you to another page that lists links for managing an aspect of SQL Server.
You will see an editable grid, which displays the contents of the Products table. The grid is part of the graphical query builder in Enterprise Manager. You can use the query builder to build and execute queries based on one or many tables.
On the Connections tab, note that the Maximum Concurrent User Connections option is set to 0. This means that SQL Server automatically configures the number of user connections, up to a maximum of 32,767. The Default Connection Options list allows you to configure ANSI defaults for user connections. When a client application connects to SQL Server, data sent between the client and the server can be formatted in a number of ways. These options specify defaults for how data should be formatted. For example, SQL Server can accept or not accept identifiers, such as database or table names, that are enclosed in double quotes (Quoted Identifier). These defaults can be overridden by clients.
On the Memory tab, note that SQL Server is set to dynamically control memory usage.
SQL Server Query Analyzer
SQL Server Query Analyzer is a graphical user interface for designing and testing Transact-SQL statements, batches, and scripts interactively.
NOTE
Query Analyzer replaces the ISQL/w tool found in previous versions of SQL Server.
Query Analyzer provides the following features:
- Free-form text editor for keying in, saving, reusing, and executing Transact-SQL statements and scripts.
- Color coding of Transact-SQL syntax to improve the readability of complex statements.
- Results presented in either a grid or a free-form text window.
- Graphical diagramming of showplan information showing the logical steps built into the execution plan of a Transact-SQL statement. This allows programmers to determine what specific part of a poorly performing query is using a lot of resources. They can then explore changing the query in ways that minimize the resource usage while still returning the desired data.
- Index analysis to analyze a Transact-SQL statement and the tables it references to see if adding additional indexes will improve the performance of a query. (You will learn about graphical showplan output and analysis in Chapter 14.)
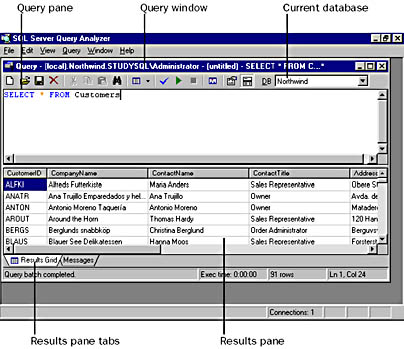
The main parts of the Query Analyzer window, shown in Figure 4.5, are as follows:
- Title bar—Shows the name of the server, current database, and login for the connection.
- Current database (DB on the query window toolbar)—Shows and allows you to change the current database for the connection.
- Query pane—Color-coded Transact-SQL editor for entering queries to be sent to SQL Server (executed).
- Results pane—Displays the results of executing a query. One or more of the following tabs will be present in the results pane:
- Messages tab: Shows information and error messages sent back from the server.
- Results tab: Shows results as free-form text. Select Results In Text from the Query menu to show results in this way.
- Results Grid tab: Shows results in a simple scrollable grid. The results grid is not editable. Some queries will cause the server to return more than one result set, in which case there will be more than one Results Grid tab. If the results grid is blank after executing a query, it means that the query did not return a result set. Check the Messages tab for error messages or enter a query that returns a result set. Select Results In Grid from the Query menu to show results in a grid.
- Execution Plan tab: Shows a graphical diagram of the execution plan for the current query. Select Show Execution Plan from the Query menu to show this tab.

Figure 4.5 The main parts of the Query Analyzer window
You can open multiple query windows in Query Analyzer. This allows you to work in different databases or execute different scripts at the same time. Each window makes its own separate connection to the server (you can use different login credentials for different windows). These connections maintain different settings, and each has its own current database. If you try to perform an exclusive operation on a database from one window while another window is using the database, the operation will fail.
To open a new query window using the login credentials and settings of an existing window, select New Query from the Query menu. To open a new query window using different login credentials and default settings, select Connect from the File menu.
Notice the following when you use Query Analyzer:
- You can type in new queries or open saved queries. When you are finished working with a query, you can save it to a file for reuse.
- Queries can consist of a single statement or multiple statements. Certain statements cannot execute in a query batch with other statements. In such cases, separate the statements with the Transact-SQL batch separator, which is the keyword GO.
- Statements can be typed on a single line or across many lines. Many Transact-SQL statements are too long to fit on a single line. Typing them on multiple lines is recommended as it makes the statement easier to read.
- If no code in the query pane is selected when you execute the query, the entire contents of the query pane are executed. If you select code, just the selected code executes; this makes it easy to test individual statements without opening new windows.
- When you execute a query, Query Analyzer sends the query to SQL Server and then waits for a reply. The query window status bar indicates the status of the query, how long the query has been running, and the number of rows returned by the query (an animated globe also spins on the query toolbar).
- Select Parse from the Query menu to parse a query. Query Analyzer sends the query to the server, and the server parses but does not execute the query. The server returns either a message indicating that the query is correct or an error message.
The following table lists a number of useful keyboard shortcuts you can use in Query Analyzer.
| Action | Keyboard shortcut |
|---|---|
| Execute | Ctrl-E or F5 |
| Find | Ctrl-F |
| Change selected text to uppercase | Ctrl-Shift-U |
| Change selected text to lowercase | Ctrl-Shift-L |
| Results In Text | Ctrl-T |
| Results In Grid | Ctrl-D |
| Help using Query Analyzer | F1 |
| Help with a selected Transact-SQL statement | Shift-F1 |
Exercise: Using Query Analyzer
In this exercise you will use Query Analyzer and explore many of its features.
- To use Query Analyzer
- Log on to Windows NT as Administrator or to another account that is a member of the local Administrators group.
- Open Query Analyzer from the Microsoft SQL Server 7.0 Programs Start menu. Connect to SQL Server using Windows NT authentication.
- In the query pane, type
- Click Execute Query on the toolbar. The query returns information in the results pane indicating the version of SQL Server and Windows NT that you are using.
- In the DB box, select Northwind. In the query pane, type
- Click the Execute Query button on the toolbar. The query returns rows of data from the Customers table in the results pane. The output displays as free-form text.
- On the Query menu, click Results In Grid.
- Click the Execute Query button on the toolbar. The query returns rows of data from the Customers table in the results pane. The output is displayed in a grid.
- Click the Messages tab in the results pane. The results pane displays messages that were returned when the query was executed.
- In the DB box, select pubs. In the query pane, type
- Click the Execute Query button on the toolbar. The query returns information about the current database (pubs) in the results pane. There are now two results grids in the results pane, as the sp_help system stored procedure returns both a list of objects and a list of datatypes in the database.
- On the File menu, click Open. A dialog box warns you that you are going to lose the current contents of the query pane. Click No, as it is not necessary to save the changes in this case.
- Navigate to and open C:\Sqladmin\Exercise\Ch03\Savedqry.sql.
- Click the Parse Query button on the toolbar. An error message displays in the results pane, indicating that the query is invalid.
- Change the INNERJOIN clause on line 12 to INNER JOIN (add a space between INNER and JOIN). The change in the color coding indicates that the clause is now being recognized. Click the Parse Query button on the toolbar again. The message in the results pane now indicates that the query is valid. This does not necessarily mean that the query will execute, just that the syntax of the query is now correct.
- Click the Execute Query button on the toolbar. The results pane indicates that an error occurred when executing the query. Change the name Category on line 11 to CategoryName. Click the Execute Query button on the toolbar again. Two results grids and some messages are shown in the results pane.
- On the File menu, click Save to save the corrected query.
- Click the New Query button on the toolbar. A second query window opens. This query window opens a separate connection to the SQL Server.
- In the new query window, in the DB box, select master. This makes the master database the current database for the second query window. The Northwind database is still the current database for the first query window.
- In the new query window, in the query pane type
- Click the Execute Query button on the toolbar. A list of the databases on the server is displayed in the results pane.
SELECT @@VERSION |
SELECT * FROM Customers |
EXEC sp_help |
SELECT * FROM sysdatabases |
(sysdatabases is a system table that you will learn about in the next section.)
Lesson Summary
SQL Server 7 provides a number of client utilities to be used in the administration of a server and the implementation of a database. The Enterprise Manager provides a user-friendly interface with which an administrator can configure a SQL Server and build database objects. The Query Analyzer can be used for a number of tasks, including running queries against database tables, executing stored procedures that retrieve or modify information in a database, and executing system stored procedures that change or retrieve configuration settings.
EAN: 2147483647
Pages: 100