Chapter 1: Packet Filtering and Offsets
Overview
When you first powered up that analyzer, you probably spent hours looking at wonderful charts, graphs and decoded packets. You experienced protocol analysis in a relatively passive mode - looking at the interpretations of the traffic trends and activity on your network.
Next, you probably got a bit curious about the type of traffic you were seeing. You saw some strange packets or maybe an unusually high amount of traffic from a single source.
Then, perhaps you attended one of my lectures about Internet Control Message Protocol (ICMP) and realized that you'd better dig into the packet-level a bit further. You downloaded RFC 792 and read the other podbooks that give meaning to and examples of the ICMP traffic you should watch for.
Now… you're ready to become pro-active and kick some 'packet butt,' eh? Time to really drill down to specific traffic on your network and build a library of filters that will save you time and money and very possibly your network.
It's time to:
-
build filters that will catch people cyber scanning your network looking for vulnerabilities
-
filter for suspect traffic coming out of the firewall
-
filter and list the sites that the cleaning crew are accessing on the night shift (the “Night Crew Filter”)
-
filter and identify infectious traffic as it enters your network
Big brother? Big sister? You betcha, buddy![1]
It does you little or no good to just look at millions of packets crossing your network unless you can categorize them and
In addition to identifying conversations, you should look at particular types of traffic on your network - all ICMP traffic or all TCP resets, for example.
| Note | You should have an analyzer running without filters in the wiring closet at all times. Set up the analyzer with a cyclical buffer (first in, first out) to see the most recent traffic only. When a major fault occurs, stop the capture process and backtrack through the conversations and general traffic to view evidence leading up to the time of failure or problems. -- Laura |
If I were standing next to you right now, I'd pat your back and tell you that I am thrilled that you are building up your knowledge of filtering techniques! This is what really separates the 'weekend protocol analyst' from the professional protocol analyst.[2] Using a solid knowledge of packet structures and strong tool skills (i.e., you can configure the filters on your analyzer), you can build a filter that will catch Fred making coffee (well… almost).
What Exactly is a Filter?
A filter is a set of criteria that a packet must match to be accepted in the trace buffer or displayed. For example, a filter based on all packets to 0xFF-FF-FF-FF-FF-FF is a standard broadcast filter.
You, as the protocol analyst, must create a set of filters that match the traffic you are interested in. Don't count on your protocol analyzer having a very complete set of filters pre-built - the vendors have been noticeably lax on supplying strong filters out of the box.
You need to know two things to build really great filters:
-
The offset indicating where you are looking in the packet.
-
The value that you are looking for at that offset.
Figure 1 depicts the general process that analyzers go through to receive and display packets as filters are applied.
When the packets come in off the wire, the analyzer's card does some basic error checking on the packet. At this point, the packet is examined as a series of bytes with varying values. The filter that you built simple consists of an offset location and a value. If the incoming packet contains data that matches your filter in content and offset, the packet is said to 'match the filter.' If, however, a single bit does not match the filter value or offset, the packet is said to 'not match the filter'.
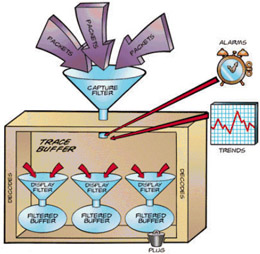
Figure 1: : Inside an analyzer.
There are two distinct types of filters, as shown in Figure 1 - capture filters and display filters (also referred to as pre-filters and post-filters respectively). We'll talk about the differences and uses of each type of filter later in this chapter.
Filters can be based on a number of characteristics of a packet - from the source or destination hardware address (the media access control or MAC address) to a single bit setting in a flags field to a specific ASCII character sequence in the data portion of the packet. Analyzer capabilities vary however, and not all options and filter types are available for all analyzers.
Figure 2 shows how a series of filters can be used to narrow down the analyzed traffic to the specific packets of interest.
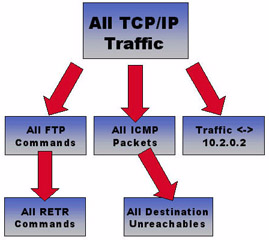
Figure 2: : Filtering enables you to focus on specific packets of interest - applying multiple filters in succession enables you to view the surrounding or related traffic as well.
Did you know that Carnivore (now called DES1000, but I prefer to use the former, less politically-correct term myself - or even the term Omnivore... he he he) contains a seriously heavy-duty set of filters based on the warrant that law enforcement carries?[3]
Placed at the ISP that handles the traffic to and from the suspect, the Carnivore system contains a filter that looks for specific email traffic.[4] Carnivore copies all packets that match the filter - law enforcement then reviews the traffic to see what the alleged 'bad guys/girls' are talking about in.
This is certainly an extreme use of filters. Most of the time, I build filters to focus in on specific traffic flows or applications. I’ll talk about this on the next page...
Capture Filters v. Display Filters
Filters are often divided into two types or functions:
-
Capture filters: (aka pre-filters) that are placed on incoming traffic to reduce the amount of traffic that flows into the trace buffer.
-
Display filters: (aka post-filters) that are placed on traffic in the trace buffer to view specific types of packets as a subset of the trace buffer - the original trace buffer contents are not erased.
I use capture filters when I know the type of traffic I am looking for straight off the wire -- all ICMP traffic, for example. I always set up my analyzer with a wonderful ICMP filter and run it on
my client's network for as long as possible.[5] I may also build a filter for all traffic that meets my Gnutella or Morpheus filter to see if any ugly[6] peer-to-peer (P2P) applications are running across the network - you'll set up the Gnutella and Morpheus (and even iMesh) filters in Chapter 4.
On the other hand, I always start my onsite visits with the 'laying on of hands' - the process of capturing all traffic on the network to get a general feel for the personality of a network. As I scan through the summary window during this process, I might find an interesting pattern or packet. In that case, I will start applying display filters to view a series of subsets of the traffic. For example, if I am cruising through the summary and I see some unanswered ARPs, I'll apply an ARP filter to the trace buffer and view only ARP traffic.[7]
At this point I'll look to see if only one device was sending out ARPs that went unanswered or if there are numerous hosts that are searching unsuccessfully on the network. If I find that only one host is sending out repetitive ARPs looking up a single IP address, there may be a configuration fault on the source or maybe there's a buggy piece of software (such as a printer driver that looks for specific print servers at specific locations).
If there are a whole bunch of hosts sending out unanswered requests for a single IP address, I'll figure that target is down or we have a slew of misconfigured hosts (this might happen when a DHCP server is configured incorrectly and messes up the clients as well). Alternately, if I see one host sending out ARPs for a whole series of IP addresses I may investigate the sending host a bit further - are they performing some type of discovery for active hosts on the local network? Are they a management agent that is trying to build a map of active hosts on a specific network segment? Are they stupid?[8]
Figure 3 shows a whole slew of ARPs that indicate a possible problem on the network. I mean, what is that guy doing in Figure 3? When does a system need to send out repeated ARPs for various IP addresses? C’mon, now!
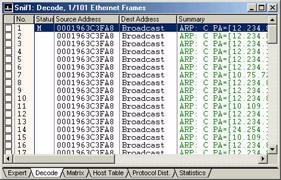
Figure 3: Wow! This guy is outta control! No one needs to ARP that often!
I'd check out this station by filtering on all its traffic next - very weird behavior! All I can think of by looking at it here is that it might be a hacker looking around the network or it could be a network management system building one of those
Sometimes you'll need to use a combination of both filter types - you'll set up a broad filter (such as all broadcasts) first and then apply more specific filters (such as all ARP broadcasts). Another example is when you set up a filter for all TCP/IP traffic and then, based on what you see there, you apply filters for one user's traffic or one specific protocol. Check out Figure 4 - what traffic would you focus on next?
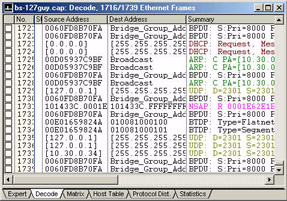
Figure 4: Which traffic would you focus on next?
If you said, "the traffic from 127.0.0.1,” you are right. Yipes! That’s the loopback address! You should never see traffic to or from the loopback address out on the wire -- that’s internal-only traffic. Next, we’d want to really focus on the all the traffic that uses the 127.0.0.1. We may then want to look at any other traffic that used the same hardware address (hoping that it was originated from the local network).
In this case, a check on port 2301 indicated that this traffic was sent to/from Compaq’s Insight Manager program -- I’d call that a really ugly bug.[9]
Now that I've defined the times that I apply a capture filter and a display filter, let me confuse you a bit… on the Sniffer, I never build display filters (right mouse click on a trace file and select "Define Filter." I only build capture filters (click on the little magic wand on the menubar). I use these capture filters as both capture and display filters.
I don’t use Sniffer’s display filters because the Sniffer's display filters can only be used on captured packets (ones that are already in the trace buffer) - what a pain! Imagine it… you captured some data and then built a really hot display filter for all NetWare File Open NCP calls. Because you created this filter as a display filter in Sniffer, you cannot set up the analyzer to capture only File Open NCP call packets directly off the wire.
Their display filters can only be used on traffic that has already been captured. Their capture filters can be used to grab specific traffic directly off the wire or reduce the number of packets within a trace file. I’m not sure why Network Associates architected the product this way... if I find out, I’ll put a note out on www.packet-level.com.
The moral of this story? Don't build display filters on the Sniffer - only build capture filters - they'll do everything you need.[10]
Filtering Overhead
You really need a decent system to build and use the more robust filters. Don't get some hand-me-down laptop from the previous network administrator who quit his/her job to work as a lounge singer.[11] Get an up-to-date system with a fast processor and tons o' memory… keep throwing memory at that system until a chip falls on the floor - that's how you'll now you've got enough memory.
Don't wimp out on the hard drive or pass up that CD-R drive. You'll need lots of drive space for the trace files you'll be storing. The CD-R provides a nice way to archive your trace files and reports over time.[12]
If your system becomes overloaded, the analyzer will begin dropping packets. Usually the analyzer provides some sort of dial or marker that indicates packets were dropped.
Filters are Based on Data Offsets
As mentioned earlier, filters are based on an offset and a data value. The offset is simply a location in the packet (how many bits or bytes into the packet). In order to ensure your filter works properly you need to define the proper offset and the proper value.
When we count the offset value, we start at zero (counting in zero-relative format). The first byte into the packet is offset 0; the second byte is offset 1; the third byte is offset 2, and so on. Let's get into the types of offsets now…
Most analyzer have two types of offsets available:
-
packet offset
-
protocol offset
The packet offset is used to define a location based on the start of the packet - the very first byte of the MAC frame.
For example, given a simple TCP/IP packet that uses the Ethernet II frame type, the packet offset starts counting at the Destination Address field in the Ethernet header. If the TCP/IP packet used a Token Ring header, the packet offset starts counting at the Start Delimiter (SDEL) field in the Token Ring header.
Figure 5 illustrates the possible problem with packet offset filters. Let's say you want to build a filter based on the value of the IP header's Version field. This field is located at exactly the 15th byte into the packet (counting from the start of the Ether- net header as offset 0, the Version field is located at offset 14).
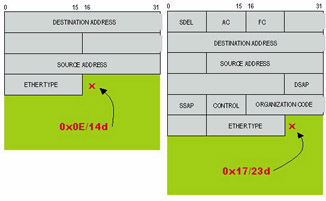
Figure 5: The starting offset of network layer data is different for Ethernet and Token Ring frame structures.
If you build a filter that looks at offset 14, this filter works for Ethernet, but not for Token Ring frames which have a larger header structure, as shown in Figure 5.
| Note | If you need more information on Token Ring frame structures, go find an old copy of “NetWare LAN Analysis” that I wrote with Dan Hakes. There’s a great Token Ring poster inside the front cover! -- Laura |
The packet offset designation is OK to use if you know what frame type your traffic is using all the time - for example, I rarely work on Token Ring networks anymore, [13] so I often build my filters using the packet offset option.
The protocol offset option takes into account that you may be applying this filter on networks that use different frame types. The offset values are based on the start of data after the MAC header. For example, the IP header's Version field is at protocol offset 0. The IP header’s Protocol field is at protocol offset 9 into the IP header.[14]
If we build a filter to look at protocol offset 9 (start counting at 0) using the protocol offset, our filter works for both Ethernet and Token Ring.
When you are interested in a field that is contained in the MAC header, you must build your filter using the packet offset value. For example, if you are interested in finding all ARP traffic (which uses the 0x0806 type number in the Ethernet II header), you must build a packet that looks for the value 0x0806 exactly 12 bytes into the packet (offset 0xC) (a packet offset).
| Note | The leading destination "0x" indicates that a number is being shown in hexadecimal format. The trailing designation "d" indicates that a number is being shown in decimal format. Appendix B contains a hexadecimal-to-decimal conversion chart and provides some hints on doing conversions using conversion tools. -- Laura |
Because I cannot assume you are working only on Ethernet networks, I will focus on building filters using the protocol option in this book.
[1]Hey… I believe that the traffic that crosses a company's network is open for inspection by that company. If you've got some private communication - use your home computer. Ok, the Civil Liberties groups hate that, but let's be reasonable here - the end user is one of the biggest security threats that a company has. Those end users must be educated on security issues/concerns and monitored. If you are interested in the rights that law enforcement has regarding eavesdropping, see Title III of the US Constitution (for US residents) - then check out the exceptions added in recent years (especially in the wake of the terrorist attacks of September 11, 2001). Ok… I'm rambling here…. back to the book, now. place them into individual 'flows' or logical one-to-one, one-to- many, or one-to all relationships.
[2]Ok, that really didn't make much sense, did it? I mean… I love looking at packets on the weekend, but I consider myself a professional protocol analyst… maybe I'm a professional weekend protocol analyst?!
[3]If you’re interested in the capabilities of Carnivore, you might be interested to look at Magic Lantern - the law enforcement trojan.
[4]OK, OK, here's a hotspot - does Carnivore have the capability to look at all traffic (not just email)? Of course it does! Do they need to someday open up Carnivore's 'window onto the network' to include other port numbers and other types of traffic? Absolutely. Will people object to this and fight tooth-and-nail to destroy Carnivore? Probably.
[5]Get "TCP/IP Analysis and Troubleshooting" from podbooks.com for more information on ICMP. Alternately, consider getting the "Packet- Level ICMP" video course from podbooks.com - you'll see me ramble on passionately about ICMP for over an hour!
[6]Stinking, lousy, unacceptable, crappy... etc. See Chapter 4 for more information on these applications.
[7]Be careful here! If your analyzer is hanging off a switch you might be seeing only the outgoing ARP broadcasts. Unless the switch is set up for port spanning or mirroring, it will be filtering out the direct unicast ARP responses. Check to see if you have any other unicast packets. If you are only seeing broadcast and multicast traffic, then unanswered traffic is the norm. Set up some port spanning or mirroring or move over to a hubbed section of the network.
[8]Always a consideration with TCP/IP stacks made by Microsoft.
[9]If you attended BrainShare Europe in 2001, you probably saw me to set up this filter live. It was a wonderful example of how you can drill down to the specific traffic of interest.
[10]Sniffer maintains their capture filters and display filters in two separate files. The capture filters are located in the SNIFFER.CSF file located in the NAI\SNIFFER\PROGRAM\LOCAL_x directory. The display filters are located in the SNIFFERDISPLAY.CSF file located in the NAI\SNIFFER\PROGRAM\LOCAL_x directory. For information about importing and exporting these filters, refer to Appendix C.
[11]Not that there’s anything wrong with that...
[12]A nice DVD drive won't hurt either - check out War Games and Tron - two old classics that are often quoted in hacker meetings, literature and code. More recently, the Matrix has proven to have the major appeal on the hackers.
[13]How sad… Token Ring networking is really fun at the packet-level. Every bit has a meaning in those Token Ring headers and the headers themselves can be of variable length (consider Token Ring source routing). Token Ring frame structures make Ethernet frame structures look simplistic and childlike.
[14]It's important to remember to start counting at zero, not one, when you are counting offsets in either decimal or hexadecimal. For example the first byte is at offset 0. The second byte is at offset 1.
EAN: 2147483647
Pages: 65
- ERP Systems Impact on Organizations
- The Second Wave ERP Market: An Australian Viewpoint
- Enterprise Application Integration: New Solutions for a Solved Problem or a Challenging Research Field?
- A Hybrid Clustering Technique to Improve Patient Data Quality
- Development of Interactive Web Sites to Enhance Police/Community Relations