Chapter 10: ASP.NET Debug and Trace
Trace is a great aid in debugging unexpected application behavior. In Chapter 9, we talked briefly about using the trace feature of ASP.NET to better understand the performance of an application. In this chapter, we’ll look at debugging and trace options in more detail. For example, you’ll learn how to send your own debug information directly to the trace output or even to an external debugger or monitoring tool. We’ll also look at how the compilation system works with trace and debugging—when you know some details about how the ASP.NET compilation system works, you can isolate problems more readily and be better able to leverage the ASP.NET platform.
Before we jump into enabling trace, let’s talk a little more about what we mean by debug and trace. As you know, ASP.NET generates code from .aspx pages and .ascx files. These objects derive from the Page and UserControl base classes and are compiled automatically by ASP.NET. When the page and user control code executes, the output is sent back to the browser. Information about the page and its contents, along with trace and debug information, can be gathered while the page executes. Data about the control tree that makes up the page as well as where the CPU cycles are spent during page execution is important to troubleshooting problems. We said that the debug information could be gathered, but it’s important to note that compilation of the generated code actually avoids the performance cost associated with debugging and tracing unless each is explicitly enabled. The trace information can be displayed at the bottom of the page, or an aggregated view can be made available by making requests to a separate trace handler.
Enabling Trace
Trace information can be gathered for an entire application or enabled on a per-page basis. When included on the page, the trace output is appended at the bottom of the regular page output, as a set of tables. To enable trace for a single page, add Trace=“true” to the Page directive. Code Listing 10-1 enables tracing.
Code Listing 10-1: Trace Hello.aspx
 <%@ Page Trace="true" language="c#" %>
<form runat="Server">
    <asp:label runat="Server" Text="Hello" />
</form>
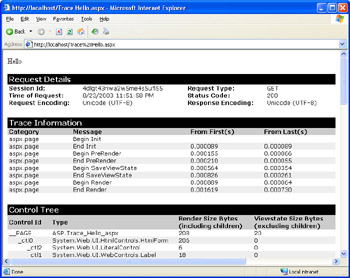
After our simple Hello text is written out, a series of tables with detailed trace information is displayed. Figure 10-1 shows what this output looks like. We’ll look at the trace information included in this page output in the section “Reading Trace Output” later in this chapter.

Figure 10-1: Trace output
As you learned in Chapter 9, in addition to turning trace output on and off for a single page, you can turn it on and off for an entire application or even globally for the machine using configuration settings. Code Listing 10-2 demonstrates enabling tracing for an application. We set pageOutput= “true” to have the trace information for each page execution included after the page output.
Code Listing 10-2: Trace Enabled Web.config
 <configuration>
    <system.web>
        <trace enabled="true" pageOutput="true" />
    </system.web>
</configuration>
Setting pageOutput=“true” is equivalent to setting trace=“true” in the Page directive for each page in the application, a convenient option when troubleshooting an application or looking at performance issues for a site.
Setting Trace Options
Five attributes can be set on the trace element to configure tracing. These settings work together to determine how tracing behaves in your application. You can include trace data directly in the page for all to see, or you can limit its visibility so that the data can be viewed only from a separate handler. You can even limit viewing to only when browsing from the server directly.
enabled Attribute
The Boolean true and false values are the values for the enabled attribute. The default value is false, meaning that trace information is not available. The trace statements included in the page are short-circuited to minimize the performance impact.
pageOutput Attribute
This Boolean attribute controls whether the output will be included in each page. If pageOutput is set to false but trace has been turned on explicitly in the Page directive, the output will still be included. The default value is false.
traceMode Attribute
The default setting for traceMode is SortByTime. This means that output is arranged chronologically based on when the trace statement occurred. For example, if you include tracing statements in the Load event, the output would appear after the Init event tracing but before the PreRender trace statements.
The other option for the traceMode attribute is SortByCategory. In this mode, the output is sorted according to category strings passed as part of the Write or Warn methods.
requestLimit Attribute
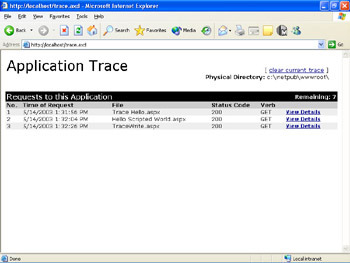
When tracing is enabled, data from the most recent requests is cached on the server. You can access this data by requesting the trace.axd handler for the Web application. For example, http://localhost/trace.axd would display the list of most recent requests to the default application on the local machine. Figure 10-2, which displays data for three requests, shows how the most recent requests are listed. Because the default requestLimit of 10 is in effect, the page also shows that there is room to hold details for seven more requests. When the eleventh request is received, information about the first request is lost. The information retained is for the most recent requests up to the number specified in requestLimit. General information about the requests, including the time, the file name, the resulting status code, and the HTTP verb used to retrieve the page, are listed. Clicking the View Details link will display the trace output as though it were included in the page, but without the actual page output.

Figure 10-2: Trace.axd listing
localOnly Attribute
Because you might include potentially sensitive debugging information in your trace output, the default behavior for trace is to honor requests to trace.axd only when those requests are made from a browser launched from the server. Requests that are not made to localhost will not have access to the data. You can enable remote viewing of trace.axd by setting localOnly to false.
EAN: 2147483647
Pages: 144