Local Testing
Once the basic functionality of your components is working, you should test the components within MTS on a single machine. This testing helps eliminate network errors and reduce security problems as you start to assemble your application. The goal is to get the entire application working on one machine—with correct transactional behavior and security checking—before you try deploying it across multiple machines. Start with individual components with no dependencies, and then test their client components, gradually working your way up to the full application.
Focus initially on ensuring that transactions work as expected. It's important to check error paths as well as the normal code path, to be sure that you are calling SetAbort, SetComplete, EnableCommit, and DisableCommit appropriately; returning the correct error codes; and handling errors correctly in your clients. Some error conditions might be difficult to reproduce in your test environment. In this case, one approach is to build special test versions of certain components that expose the same interfaces as the components but that simply generate errors rather than doing real work.
You'll probably want to start with authorization checking disabled and all components running as the interactive user. This setup helps reduce the amount of work you need to do to configure the test environment. Once the application is working, however, you should test that the components work correctly when configured to run as a particular user account other than the currently logged in user. You should also enable authorization checking and verify that any role based security checks, declarative or programmatic, work as expected.
Debugging MTS Components
If your application isn't working as expected, you might want to run your components in a debugger so that you can step through your code line by line. The mechanics of debugging components that are running within MTS vary greatly from tool to tool. The primary issues are building components with debug information and configuring the debugger so that the MTS surrogate is properly launched. In the following sections, we'll look at three debugging scenarios: using the Microsoft Visual Studio Symbolic Debugger to debug a component written in Microsoft Visual C++, using the Visual Studio Symbolic Debugger to debug a component written in Visual Basic, and using the Visual Basic 6.0 debugger to debug a component written in Visual Basic.
Debugging Visual C++ components
Debugging Visual C++ components is a fairly straightforward process. You simply need to build your components with debug information, set breakpoints, and then start the symbolic debugger. (The symbolic debugger is the usual debugger for Visual C++.) For components installed in a server package, you have two ways to launch the debugger: by using Just-In-Time (JIT) debugging or by starting the debugger from the Visual Studio Integrated Development Environment (IDE). When JIT debugging is enabled and if a program faults while the debugger is not running, the fault is trapped and you are given the option to start debugging the process at the point of the fault.
MTS supports the Visual C++ JIT and OLE/RPC debugging feature. If OLE/RPC debugging is enabled, you start debugging the application by running the client under the debugger. When you step into a method call to an object, the debugger will automatically step into the object's code in the server process (even if the server process is on another machine). Single-stepping past the return statement in the object's code returns to the next statement in the client's code. To enable JIT and OLE/RPC debugging, open the Visual Studio Options dialog box by choosing the Options command from the Tools menu, select the Debug tab, and check the Just-In-Time Debugging and OLE/RPC Debugging check boxes.
If you can't run your client under the debugger, you can prelaunch the server process under the debugger from the Visual Studio IDE. First get the package ID for your component. You can get this information from the package's Properties window in the MTS Explorer, as shown in Figure 12-1.

Figure 12-1. Locating an MTS package's package ID.
Once you have the package ID, open the Project Settings dialog box for your component in the Visual Studio IDE, as shown in Figure 12-2. Be sure that the Microsoft Win32 Debug configuration is selected, click on the Debug tab, and select the General category. Now set the executable for the debug session to the MTS Surrogate, MTX.EXE. You need to enter the complete path to the MTS Surrogate, which is located in your Windows system directory—for example, c:\winnt\system32\mtx.exe. Next set the program arguments to the string /p: {<package ID>}, where <package ID> is the value you read from the package's Properties window. (In MTS 2.0, you can also use the package name—for example, /p: <package-name>.) To save the project settings and close the dialog box, click the OK button. You can now launch the debugger from the IDE. When clients call into your components, your breakpoints will be hit and you can debug to your heart's content.

Figure 12-2. Configuring a Visual C++ project to launch MTS during debugging.
For components that are installed in a library package, you need to configure settings in the project associated with the client process. For example, if a library package is used by the bus_DoWork component, you would need to modify the settings for the bus_DoWork project. Select the Win32 Debug configuration in the Project Settings dialog box, click on the Debug tab, and select the Additional DLLs category, as shown in Figure 12-3. In the Modules list, add the component DLLs you want to debug from the library package. After you have entered the DLLs you want to debug, save the project settings and close the dialog box by clicking the OK button.

Figure 12-3. Adding MTS components to a Visual C++ debug session.
After you halt the debugger, it's a good idea to use the MTS Explorer to shut down any server processes that might be hanging about on your test machine. You do this by highlighting My Computer in the left-hand pane of the MTS Explorer and choosing Shut Down Server Processes from the Action menu. If a server process is left running, you might get an error message the next time you try to build a component whose DLL file cannot be written to because the existing DLL is still loaded in memory.
If you are using transactions, you might also want to increase the transaction time-out, which defaults to 60 seconds. Using the MTS Explorer, change the transaction time-out setting on the Options tab of the My Computer Properties window.
Debugging Visual Basic 5 components
Debugging Visual Basic components within MTS is a little more complicated, at least with Visual Basic 5.0. The Visual Basic 5.0 debugger cannot be used to debug compiled components. Instead, you need to use the Visual Studio Symbolic Debugger.
First you will need to build your component with symbolic debugging information. To do this, open the Project Properties window for your component's project in the Visual Basic IDE, and then click on the Compile tab. Select the Compile To Native Code and No Optimization options and check the Create Symbolic Debug Info check box, as shown in Figure 12-4.
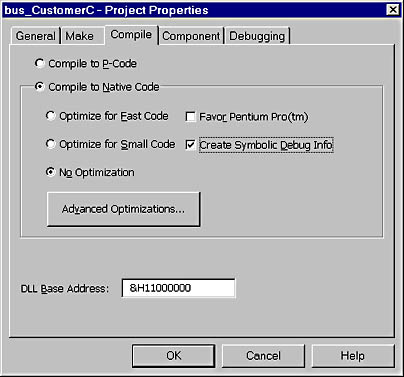
Figure 12-4. Building a Visual Basic 5.0 component with symbolic debugging information.
Next you will need to move your component DLL to wherever packages are normally installed in MTS—usually in the c:\program files\mts\packages directory. If you do not move your component DLL to this directory, you will receive an error message when you launch the debugger informing you that symbolic debugging information for the DLL could not be located. If you have trouble getting the debugger to stop at breakpoints in your component, confirm that the DLL is in the standard packages directory, delete the component from its package, and re-add the component.
You also need to set up a project in the Visual Studio IDE for your debugging session. In this project, set up the debug executable and command-line arguments as described earlier for debugging Visual C++ components. Then add the DLLs you want to debug to the list of Additional DLLs on the Debug tab of the Project Settings dialog box. Load the .CLS file for your COM classes, set breakpoints as needed, and you're ready to go.
Debugging Visual Basic 6 components
Visual Basic 6.0 lets you debug components running in MTS for certain scenarios. You can debug only one component from one client at a time. The component always runs as a library package, within the Visual Basic process. This means that you cannot debug security problems, multithreading problems, or problems that involve multiple components using the Visual Basic 6.0 debugger. However, you can use the method described earlier for Visual Basic 5.0 components to debug these problems using the Visual Studio Symbolic Debugger.
If your situation can be handled by the Visual Basic debugger, all you need to do is build the component DLL, set binary compatibility for the project, and install the component into MTS. Set breakpoints in your component code, and start the debugger from the Visual Basic IDE. When a client is run and calls into your component, the breakpoints will be hit and you can debug your component.
Traces and Asserts
In addition to running your components under a debugger, you might find it helpful to have your components output information as they are running. This information is particularly useful for troubleshooting in situations in which a debugger is not available, symbols and source code are not available, or bugs exist that don't happen when the code is run in the debugger. You need to be careful when using this technique, however, because your components might not have access to the interactive user's desktop—in other words, that handy assertion that displays a message box might position the message box where you can't see it—and where you can't click on it to close it.
The three primary places to output trace and assertion information are the desktop display, a debugger, and a file. Information written to the desktop display typically uses the MessageBox function. To be sure the message box is visible, use the MB_SERVICE_NOTIFICATION flag when you create the message box. This method is commonly used for assertions. The following code shows how you might implement an Assert or Trace function in Visual Basic:
#If DEBUGGING Then 'API Functions Private Declare Sub OutputDebugStringA _ Lib "KERNEL32" (ByVal strError As String) Private Declare Function MessageBoxA _ Lib "USER32" (ByVal hwnd As Long, _ ByVal lpText As String, _ ByVal lpCaption As String, _ ByVal uType As Long) As Long 'API Constants Private Const API_NULL As Long = 0 Private Const MB_ICONERROR As Long = &H10 Private Const MB_SERVICE_NOTIFICATION As Long = &H200000 Public Sub Assert(ByVal bCondition As Bool, _ strError As String) Dim lngReturn As Long If Not bCondition Then lngReturn = MessageBoxA(API_NULL, strError, _ "Error in Component", _ MB_ICONERROR Or MB_SERVICE_NOTIFICATION) End If End Sub #End If
To write information to a debugger, use the OutputDebugString function. If you are using MFC, the TRACE macro uses OutputDebugString to generate its output in debug builds. You can use the TRACE source code as a template for writing your own C++ macro that would work in nondebug builds as well. The following listing shows how you might implement a Trace function in the Visual Basic code above:
Public Sub Trace(ByVal strError As String) Call OutputDebugStringA(strError) End Sub
If an application is running under a debugger, OutputDebugString sends its text argument to the debugger. (In the Visual C++ debugger, OutputDebugString messages are displayed in the Output window.) Otherwise, OutputDebugString sends its text argument to the system debugger. If the system debugger is not active, the function does nothing. This technique is useful for tracing calls in which you don't have symbols and source code available.
Last you can write trace messages to a log file. This technique involves simply writing a function to open a file, append a text message, and close the file. This process will slow down your application but has the advantage that it can be used when a debugger is not available. A registry setting is a convenient way to enable or disable logging for a particular application or component.
Decoding Error Messages
You should check return values from all COM method calls. COM might be reporting information about system errors, in addition to any application-specific errors your components generate. This information becomes particularly important when you start testing in a distributed or secure environment, because COM might report access violations or communication errors in the method return value.
As we saw in Chapter 9, COM reports errors using 32-bit values called HRESULTs. To figure out what a particular HRESULT means, you can use the Error Lookup utility provided with Visual C++, ERRLOOK.EXE. ERRLOOK is shown in Figure 12-5. You can enter the HRESULT value as either a decimal value or a hexadecimal value.

Figure 12-5. The Error Lookup utility.
ERRLOOK uses the FormatMessage API function to retrieve the message text for system error codes. You can easily call this API function in your own code to retrieve standard message text for system errors.
Troubleshooting Database Problems
If your data access components are not able to access their data sources, you'll need to use your database management system (DBMS) tools and the tools provided by ODBC to track down the problem. If you are using SQL Server, you can use the SQL Enterprise Manager to test connecting to a database, issuing queries, and so on. The SQL Trace program can be used to watch operations against your database. You can also use the Visual Data Tools and SQL debugging features of Microsoft Visual Studio Enterprise Edition.
If you are accessing a data source via ODBC, your data source driver may allow you to use the ODBC driver manager to test accessing the data source using a particular data source name (DSN). Open the ODBC Control Panel applet, select a DSN, and click the Configure button to launch the DSN Setup dialog. Step through the setup dialog boxes until you get to the option to test the DSN.
ODBC also provides a trace facility that you can use to help troubleshoot ODBC errors. Tracing is enabled from the ODBC Control Panel applet. Trace messages are written to a log file. After you run your program, you can examine this log file for details of the ODBC commands that were executed. Remember to turn off tracing once you have a log file that captures the ODBC calls and errors for the scenario you are troubleshooting!
If you are able to access data sources manually but not from your MTS components, verify that you are using data sources that are compatible with MTS. In particular, ensure that the ODBC drivers you are using support MTS. If you can access data sources from within MTS but transactions aren't working correctly, verify that the Microsoft Distributed Transaction Coordinator (MS DTC) is running and properly configured on all machines involved in the transaction.
MTS Tools for Troubleshooting
In addition to trace code you add to your components, you can use two tools provided by MTS to figure out whether your components are being activated and what methods are being called. We'll look at these tools in detail in the following sections.
MTS Explorer as a diagnostic tool
If you are having trouble figuring out whether an object has been created, you can use the MTS Explorer to monitor the status of components in your server packages. You can see whether objects are created by viewing the Components folder for your package. When an object running in a server process is activated, the icon associated with its COM class in the right-hand pane of the MTS Explorer will spin. To see how many objects are activated and how many objects are handling calls, use the Status view for the Components folder, as shown in Figure 12-6.
NOTE
If you don't have a client application handy to create an object, you can use the OLE/COM Object Viewer, OLEVIEW.EXE, to conduct a quick and dirty test. This tool is provided with the Platform SDK and Visual C++. Select a COM class in the left-hand pane of the viewer, and then choose the Create Instance command from the Object menu to create an object. Choose the Release Instance command from the Object menu to destroy the object.

Figure 12-6. Monitoring package status using the MTS Explorer.
You can also use the MTS Explorer to monitor transactions. The Trace Message, Transaction Statistics, and Transaction List windows provide information about the status of transactions managed by the MS DTC. To view one of these windows, highlight the computer that is hosting the transactions in the left-hand pane of the MTS Explorer—for local testing, highlight My Computer. Next double-click on the icon for the window you want to view. The Trace Message and Transaction List windows are most useful once you start testing your application in a distributed environment, where MS DTC errors are most likely to occur. The Transaction Statistics window is useful for figuring out whether transactions are being used the way you expect them to be.
MTS Spy
MTS Spy is a debugging aid included as a sample in the MTS SDK. MTS Spy produces a trace of MTS events, including the following:
- Package shutdown
- Object creation and release
- Object references, consistency, activation, and deactivation
- Method call, return, and exceptions
- Transaction startup, preparing to commit, and abort
- Resource dispenser connection, allocation, and recycling
- Thread allocation and recycling
You can also add code to your components to fire custom events. MTS Spy is especially useful for determining exactly what is going on while your application is running, particularly in multiple-client scenarios.
NOTE
The MTS SDK is included in Platform SDK releases after January 1998. You can also download it from ftp://ftp.microsoft.com-/bussys/viper/SDK/.
MTS Spy is built on top of a general event notification system included in MTS. The MTS Executive generates events, which are queued by the MTS Event system, MTSEVENTS.DLL. MTSEVENTS.DLL then broadcasts events to any event sinks listening for particular events. MTSEVENTS.DLL does not guarantee that all events will be delivered to all event sinks. Still, MTS events are a useful diagnostic tool.
Before you can use MTS Spy, you need to build it. MTS Spy is written using Active Template Library (ATL) 2.0 and can be built using Visual C++ 5.0 or later. Once you have installed the MTS SDK, build the MtsSdkPs project, located in the ProxyStub subdirectory, and the Include project, located in the Inc subdirectory, to build and register proxy/stub DLLs, type libraries, and header files used by the SDK samples. Then build the MtsSpyCtl project, located in the MtsSpyCtl subdirectory, and the MtsSpy project, located in the MtsSpy subdirectory.
To start spying on a package, first start the package process or client application. The package must be running before you can start spying on it. Then run MTSSPY.EXE, as shown in Figure 12-7.

Figure 12-7. The MTS Spy utility.
From the Spy menu, choose the Select Packages command to open the Select Events dialog box, as shown in Figure 12-8. Select the package you want to monitor from the Running Packages combo box. Then select the types of events you want to monitor from the Possible Events list box and click the right arrow button to move the events to the Current Events list box. Click OK to close the dialog box. MTS Spy will start capturing the specified events and will display them in the main window. You can use the Save To File option on the Spy menu to write out the event list for future reference. As you can see in Figure 12-7, each event includes a great deal of information. For example, when a method call returns, you get the CLSID, IID, offset into the interface vtable, and return code for the call. Using this information, you can figure out exactly what method was called.

Figure 12-8. Selecting the package to monitor using the MTS Spy utility.
If MTS Spy doesn't provide the information you want, you can write your own event sink to monitor MTS events or you can modify the MTS Spy source code. See the MTS SDK for more information about writing your own event sink.
Visual Studio 6.0 Enterprise Edition includes a more powerful event-tracking application, called the Visual Studio Analyzer. The Visual Studio Analyzer uses a generic debugging event infrastructure that is supported by COM, MTS, ADO, and IIS. You can use this tool to collect diagnostic information about nearly every aspect of your distributed application. See the Visual Studio 6.0 documentation for more information about Visual Studio Analyzer.
The Windows NT Event Viewer
The Event Viewer is a Windows NT application that displays system-level, security-level, and application-level events that are written using the Windows NT event-logging API. Most of the system services you use in your application, such as COM, MTS, the MS DTC, SQL Server, and so on, use the event log to record interesting information about the service. For example, DCOM writes events to the system event log whenever it cannot log on as a particular user account to run a server. MTS writes error message events to the application event log. You can also write to the event log from your own components and applications.
To run the Event Viewer, from the Windows NT Start menu choose Programs, Administrative Tools, and then the Event Viewer command, or double-click on EVENTVWR.EXE in your Windows NT system directory. The Event Viewer displays a list of events for one log at a time—system, security, or application—as shown in Figure 12-9. Double-click on an event to view a detailed description. The Event Viewer is particularly useful for detecting why system services don't seem to be running correctly or why components aren't created as expected.

Figure 12-9. The Windows NT Event Viewer.
Tips for Mental Health
During local testing, it's important to maintain a disciplined approach to setting package, component, and interface attributes. An unexpected security or transaction setting can turn mild-mannered developers into raving lunatics. ("The code looks right, so why doesn't it work?!") You should also develop a consistent routine for shutting down applications, rebuilding components, and refreshing MTS packages. Observing the existing behavior in a component after fixing a bug is even more frustrating than forgetting to set transaction attributes correctly!
EAN: 2147483647
Pages: 98