Monitoring and Administering a Notification Services Instance
| Once you have deployed your Notification Services instance, it's important to constantly monitor it to ensure that it is running without problems and performing as expected. Notification Services provides monitoring information through the following means:
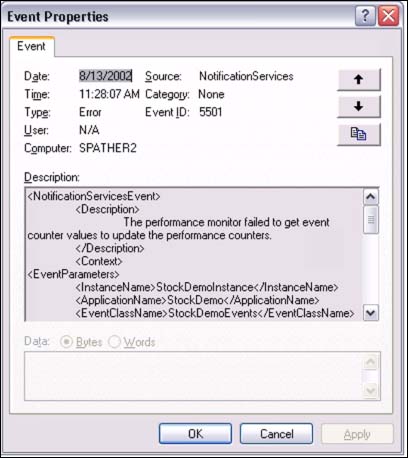
The following sections describe how to use these to monitor your instance. The Windows Application Event LogThe Windows Application Event Log is generally the place to start when checking the behavior of the system. Notification Services writes various types of log entries, including verbose, informational, warning, and error messages. All log entries written by Notification Services will specify "NotificationServices" as the event source. Figure 45.3 shows an example of a typical error message from Notification Services. Figure 45.3. An error message written to the Windows Application Event Log by Notification Services. If something abnormal occurs during the running of your notification applications, Notification Services will usually write an error or warning event log entry. These entries all have the same structure: They begin with a description of the issue, and then list the details of the component to which it relates (usually the entry will specify at least the instance name, the application name, and the name of the computer, but it may also contain other information such as the name of a particular event provider), followed by more technical details about the problem. Each event log message contains a link to a Microsoft Web site that provides more information, including possible causes of the problem being described and potential resolutions . Performance Monitor ObjectsNotification Services provides several performance monitor objects that you can use to track various aspects of a running instance. These performance objects can be tracked in the perfmon tool, or any other tool that displays information from Windows performance monitor objects. The Notification Services objects are classified into three groups:
Notification Services Books Online provides a detailed description of each counter available in the various performance objects. Reporting Stored ProceduresNotification Services provides a set of stored procedures that provide detailed reporting information about an instance or application. There are three categories of reports :
It is a good practice to run snapshot reports at regular intervals to observe the instantaneous behavior of the system. This can provide you with a quick insight into the health of the instance and can highlight problems that may have occurred. For example, one of the data points returned by the application's snapshot report is the amount of time that has elapsed since the last batch of notifications was generated. In an application that generates notifications fairly regularly, one would expect this to always be a fairly small value. If the snapshot report shows that in fact a lot of time has passed since a notification batch was generated, it can be an indication that something is wrong. Perhaps the application isn't receiving any new events, or the generator is not functioning correctly. Having been alerted to the problem, you can make a fuller diagnosis by examining the Windows Application Event Log for error information, or executing other reports to isolate the source of the problem. The diagnostic reports are useful when you want to examine the behavior of an aspect of an instance or application during a particular time interval. For example, you can execute the diagnostic event class report for a particular event class, passing it a start and end time of interest. The report will return information about activity relating to that event class during the specified time interval. This will include how many event batches of that class were collected, the event collection rate, how long it took for the generator to process those event batches and generate notifications, and how long it took for those notifications to be distributed. The detail reports can help diagnose problems with a particular Notification Services entity, such as a specific notification or event batch. For example, the notification batch details report can provide details on a particular notification batch. The information returned will include the number of notifications in that batch, how long the batch took to generate, and the delivery status of the notifications in that batch. Notification Services Books Online provides detailed information about the individual reporting stored procedures, along with the exact information returned by each one. |
EAN: 2147483647
Pages: 503