Exploring the Standard Views
| < Day Day Up > |
| Views can be categorized in two different ways. The first logical breakdown of views is whether they display tasks or resources. All views focus on one or the other but not both. The next method of categorizing views is by their format. There are basically three different formats for views: sheets, forms, and graphs. Table 19.1 summarizes the predefined views, using these category breakdowns. The views marked with an asterisk must be accessed by choosing View, More Views (see Table 19.1). Table 19.1. Supplied Views by Format and Focus
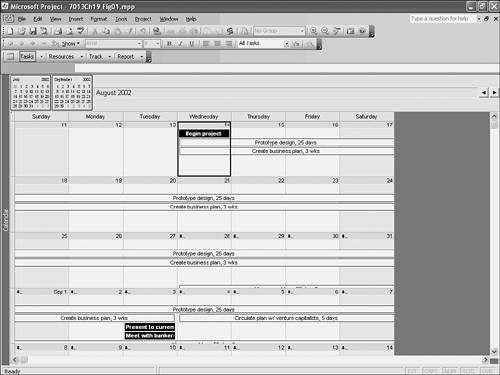
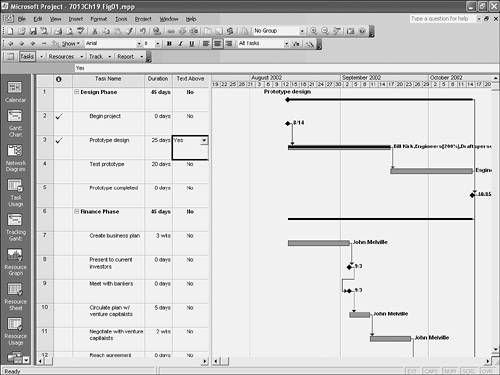
The views listed with the Gantt Chart view are all based on a standard Gantt Chart view, except that they have different tables applied and the bars are formatted differently. See the section "Exploring the Standard Tables," later in this chapter, for a discussion of these different tables. The combination views are two standard views that are displayed on the same screen. They provide a unique combination of information, and they are described at the end of this chapter. The following sections describe each of the views, with all the task views first and then the resource views. The Calendar ViewIn the popular Calendar view (see Figure 19.1), tasks are displayed in a familiar calendar format. Each task is displayed as a bar that spans the days and weeks during which the task is scheduled to occur. Many people can more easily visualize a project when they can see it displayed in this familiar format. This view can be very useful for reviewing a project plan, for editing a project after the initial design has taken place, and for printing. Figure 19.1. The Calendar view displays tasks in a familiar format as you view, edit, or print a project. CAUTION Although it's possible to create a project by using the Calendar view, it is not generally advisable to do so. Creating tasks in the Calendar view causes date constraints to be applied to the tasks. Quite often, the calendar displays too many tasks at once, and it becomes difficult to see what you want. You can apply filters to hone in on particular categories of tasks ”for example, tasks that are in progress, top-level tasks, or tasks that use a particular resource. This last type of filter is very helpful when you want to give each resource a list of his or her respective tasks. Filters are discussed at the end of this chapter. The Gantt Chart ViewThe Gantt Chart view, one of the most popular project management views, is actually a task sheet on the left side and a bar chart on the right (see Figure 19.2). The chart is a list of tasks displayed as bars that overlay a timescale. The length of the bars is determined by the duration of the tasks. The placement of the bars on the timescale is determined by the start and finish dates of the tasks. Dependency lines are drawn to show the predecessor and successor relationships between tasks. Figure 19.2. The Gantt Chart view draws bars on a timescale to show when tasks occur. The Gantt Chart view is useful during many stages of a project. During the initial planning stages of a project, you can use this view to enter tasks, make determinations about dependency relationships, and even assign resources. After the initial planning phase, you will probably need to evaluate and adjust the schedule. The Gantt Chart view is useful in immediately displaying the effect of your efforts. After the project is underway, the Gantt Chart view offers a practical display of tasks that are in progress as well as those tasks that are behind or ahead of schedule. The options for formatting the Gantt Chart view are so numerous that there is even a special automated tool, the Gantt Chart Wizard, which walks you through the process. The Rollup ViewsSeveral of the views based on the Gantt Chart view are grouped together because they are all rollup views ”information from detail tasks has been rolled up onto collapsed summary tasks. This is useful when the outline level for a detail task is collapsed but you would still like to see where that task falls along the summary task. The technique of using rollups is discussed in greater detail in Chapter 12, "Reviewing the Project Plan." This section describes the various predefined rollup views that are available, what information they provide, and how they are different from one another. When choosing which rollup view to display, ask yourself what you would like to see along with collapsed summary tasks. These are your options:
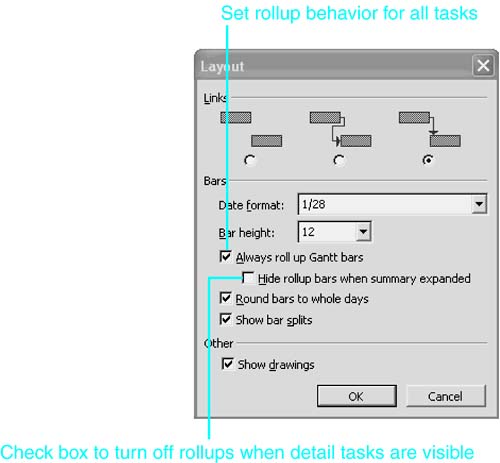
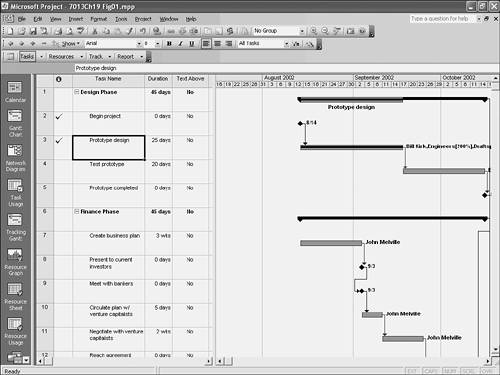
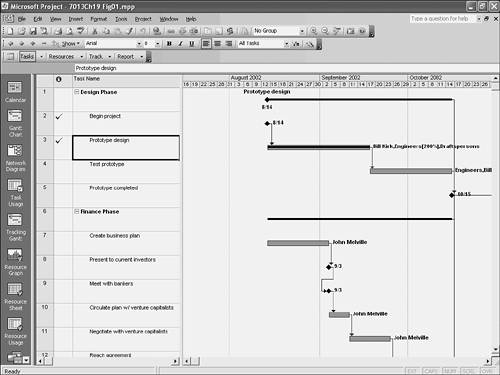
The rollup views use a field called Text Above. This field, which is visible on the Rollup table, offers a drop-down list with Yes and No as the options. When Yes is selected, the task name appears above the summary taskbar, rather than below it, which is the default. The rollup feature can also be enabled on an individual task by selecting that task, opening the Task Information dialog box, and checking the General tab option Roll Up Gantt Bar to Summary. You can also set Project to roll up all tasks and either show the rollups at all times or only when the summary tasks are collapsed. Select Format, Layout to set these features (see Figure 19.3). Figure 19.3. All tasks can be set to roll up to their summary tasks. CAUTION Because rolled-up task names appear above the summary taskbar, there is an increased likelihood that the task names will overlap. You might need to increase the span of the timescale, shorten the task names , or be more selective about which tasks are rolled up. The Bar Rollup ViewIf you roll up a task other than a milestone, the summary taskbar looks more like a task than a summary. This is useful when you want to highlight certain tasks when task details are not displayed. Figure 19.4 shows the rollup of the Prototype design task. Figure 19.4. The Bar Rollup view allows you to emphasize specific task details in a collapsed outline. The Milestone Rollup ViewThe Milestone Rollup view is similar to the Bar rollup view. As shown in Figure 19.5, when tasks are marked as Rolled Up, only the milestone task names are rolled up ”not the dates. This view is useful for creating a summary display of only the specific project events ”the milestones. If tasks (rather than just milestones) are rolled up, only a diamond shows for them on the summary taskbar, rather than a bar, as in the Bar Rollup view. Figure 19.5. The Milestone Rollup view allows you to selectively place some rolled-up task names above the summary taskbar and some below it. The Milestone Date Rollup ViewThe Milestone Date Rollup view includes dates rolled up to summary tasks, along with names. Displaying dates on the chart eliminates the need to print columns of dates, which can reduce the number of pages to be printed. As shown in Figure 19.6, the names of the milestones appear above the summary taskbar and the date appears below it. A diamond appears on the end of the summary taskbar only if you roll up a milestone to it. Figure 19.6. The Milestone Date Rollup view automatically puts names above the summary taskbar and dates below it.
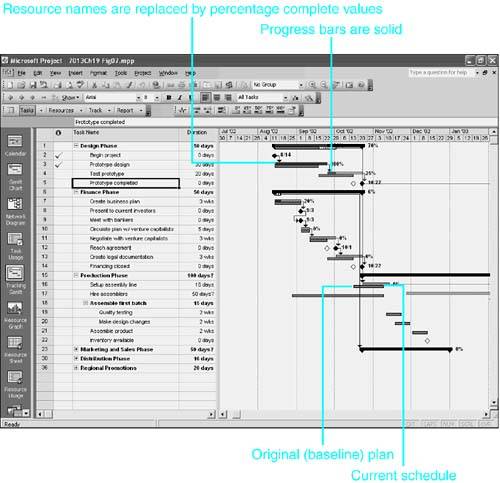
The Specialized Gantt Chart ViewsFollowing the same general format of the Gantt Chart view, the specialized Gantt Chart views have been specifically formatted to highlight certain project scheduling issues. One of the most useful views in Project is the Tracking Gantt view, in which you can see at a glance if your tasks are on their baseline schedules or how far they have slipped. The Leveling Gantt view is useful for examining and resolving resource overallocation problems. The Detail Gantt view shows task movement from leveling delays and remaining task slack . The Tracking Gantt ViewThe Tracking Gantt view is available on the View bar as well as the View menu. It is based on the standard Gantt Chart view but includes an additional gray bar, below the regular taskbar, with the baseline information (see Figure 19.7). Task progress is shown two ways: A solid color is shown on the scheduled taskbar ”instead of the Gantt Chart view's black progress line ”and the percentage complete value is shown on the right side of the bars. Figure 19.7. The Tracking Gantt view gives a snapshot of how the project is progressing.
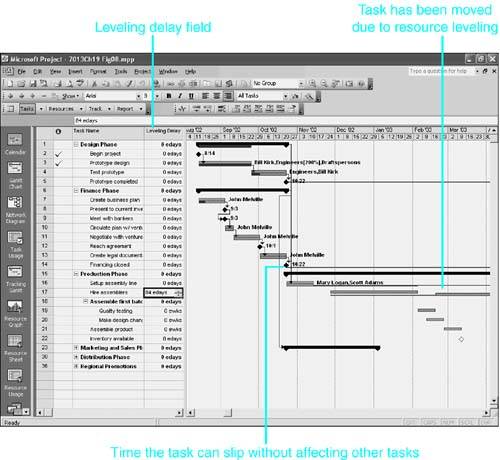
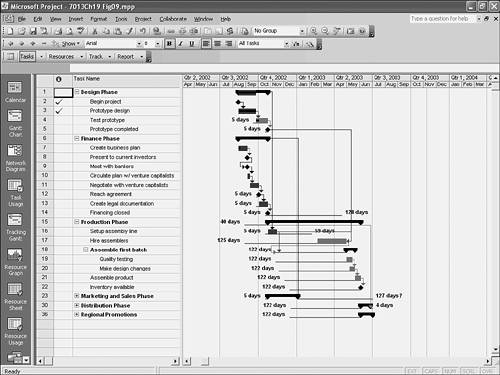
CAUTION The baseline bars are not displayed if the baseline has not been saved or has been cleared. The Leveling Gantt ViewThe left side of the Leveling Gantt view uses the Delay table, which includes the leveling delay field. This is where Project notes delays it calculates during automatic leveling, and where you can enter a delay in a task if a resource is too busy with other tasks. Several bars are included in this view for each task (see Figure 19.8). Extending to the left of each task is a very narrow bar that is drawn from the earliest date a task can start and shows any leveling delays on the task. Extending to the right of each taskbar is another very narrow bar that depicts free slack (that is, the amount of time a task can be delayed without delaying any other tasks). Using this bar, you can see how much a task can be delayed without causing a delay in another task. Colored bars show the task as currently scheduled. A dotted line shows where the task has been split as a result of leveling. Figure 19.8. The Leveling Gantt view allows for the input of, and shows the effect of, delaying tasks. The Detail Gantt ViewThe Detail Gantt view is very similar to the Leveling Gantt view in that it shows where delays have been created as a result of leveling, whether performed by Project through automatic leveling or by you through manual leveling. The Detail Gantt view (see Figure 19.9) does not show how the task was scheduled before it was delayed, as the Leveling Gantt view does, but it includes text that shows the slack amount at the right side of the slack bars. Figure 19.9. The Detail Gantt view is another tool for keeping track of tasks that have been delayed or that could be delayed, to resolve resource overallocations. The Multiple Baselines Gantt ViewProject 2003 can store 10 sets of baseline values for a single plan. The rescheduling of tasks over time is charted on the new Multiple Baselines Gantt view. The taskbars on this view are formatted to show the original baseline schedule, as well as the revised schedules stored in the Baseline1 and Baseline2 fields. PERT Analysis ViewsThe PERT Analysis toolbar displays several special views that are associated with PERT analysis (which is the calculation of duration, using a weighted average of best-case, worst-case, and most-likely-case duration estimates). The easiest way to access these views is through the PERT Analysis toolbar. These views are not initially listed with the other views when you select View, More Views. You must first access them through the PERT Analysis toolbar, after which they display in the list of views.
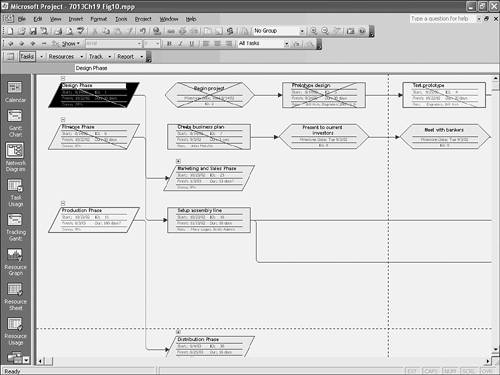
The Task Relationship Diagram ViewsThree views let you focus specifically on the linking relationships between tasks. The Network Diagram view and Descriptive Network Diagram view each display the entire project in a box-and-line format. The Relationship Diagram view focuses on a specific task and its immediate predecessors and successors. These views are described in the following sections. The Network Diagram View
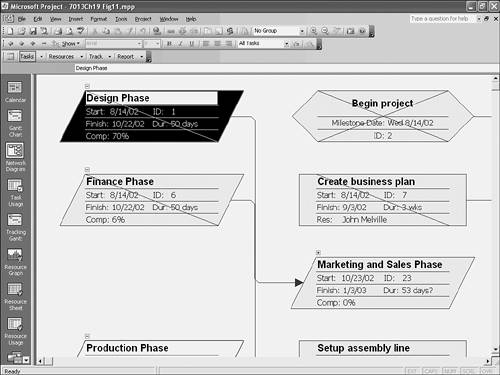
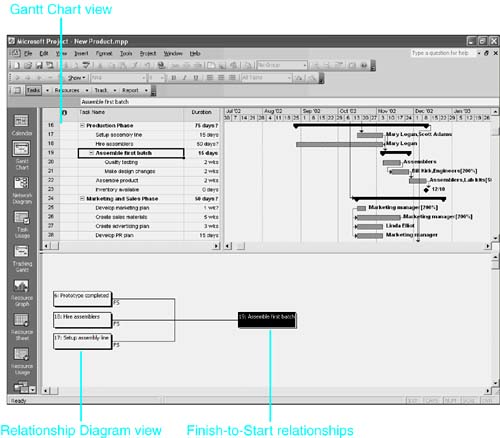
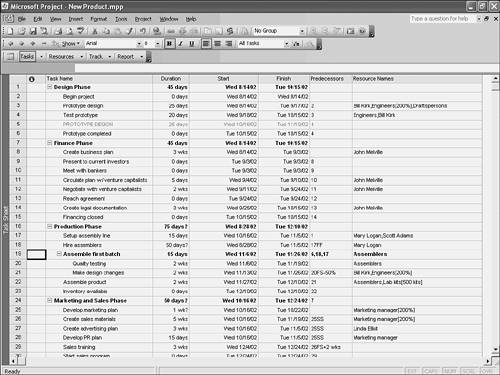
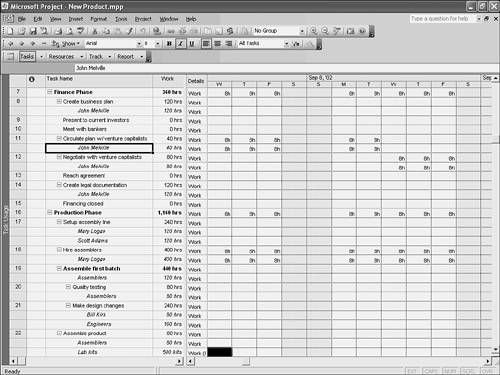
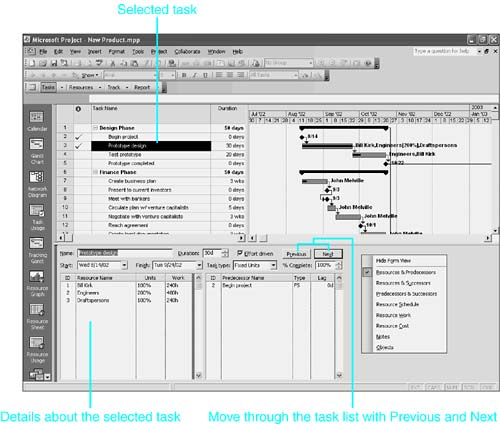
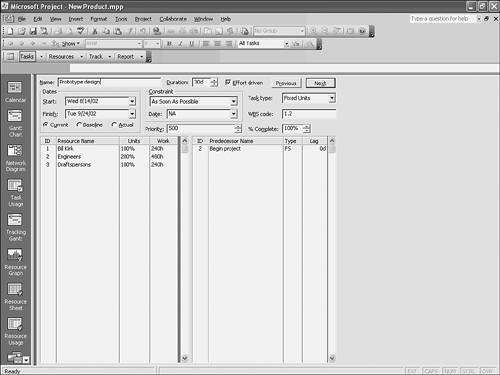
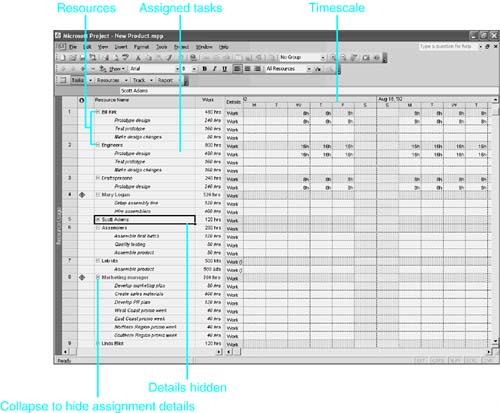
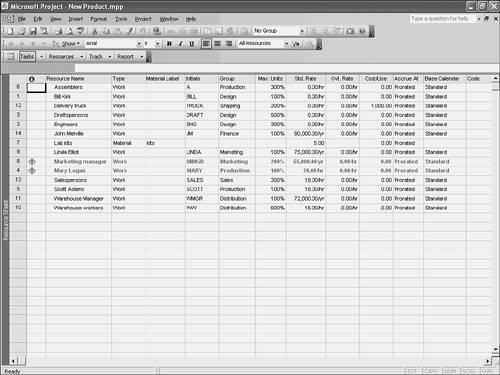
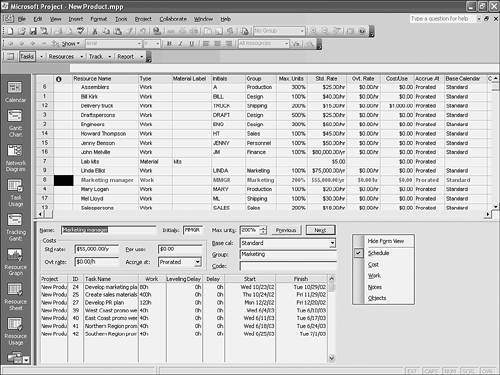
Figure 19.10. The Network Diagram view helps define the logic of predecessors and successors for the project plan. If you move the mouse pointer close to a task node, Project zooms in to show a detailed view of that node. When you double-click a task node, the Task Information dialog box for that task is displayed. Outline symbols can be used to hide or display subtasks of summary tasks to see different levels of detail. The Network Diagram view can also be filtered to reflect only tasks that meet certain criteria. There is no timescale in the Network Diagram view, but you can reorder tasks according to time periods by selecting Format, Layout, and then choosing one of the options in the Arrangement box from among Top Down by Day, Week, or Month. The Descriptive Network Diagram ViewThe Descriptive Network Diagram view is almost identical to the Network Diagram view. This view also focuses on the dependency relationships between tasks. However, the boxes that make up the Descriptive Network Diagram view provide more detailed information regarding the tasks they represent. As shown in Figure 19.11, the Descriptive Network Diagram view illustrates the dependency relationships between tasks, and it provides additional information about those tasks. As with the Network Diagram view, if you move the mouse pointer close to the task node, Project zooms in to show a detailed view of that node. Outline symbols can be used to hide or display subtasks of summary tasks, and task filters can be applied. Figure 19.11. The Descriptive Network Diagram view provides additional task information for analyzing task dependencies. The Relationship Diagram ViewThe Relationship Diagram view is a special kind of Network Diagram view. As shown in Figure 19.12, the Relationship Diagram view is typically displayed at the bottom of a task view. It shows only the immediate predecessors and successors for the task that is selected in the top pane. This is a very useful view when examining the task dependencies of the project, particularly when you're making sure that every task is linked and that the links all make sense. For example, in Figure 19.12, the dependencies for Task 18 are much clearer in the Relationship Diagram view shown in the bottom pane than in the Gantt Chart view in the top pane. The type of the relationship is also displayed in the Relationship Diagram view. Figure 19.12 clearly shows that each of the predecessors has a Finish-to-Start relationship with Task 18. Figure 19.12. You can use the Relationship Diagram view to make sure that every task has at least one predecessor and successor and that all relationship links make sense. Sheet Views for Tasks ListsProject classifies any view that focuses on task or resource information but does not include a graph as a sheet view. The task-oriented sheet views ”Task Sheet view and Task Usage view ”are described in the following sections. The Task Sheet ViewThe Task Sheet view has a spreadsheet format. Tasks are displayed in rows, and fields of information about those tasks are displayed in columns. The fields (columns) that are displayed are determined by the table that has been applied. (See the section "Exploring the Standard Tables," later in this chapter, for more details about tables.) This view is preferred by people who like working in a row-and-column format rather than with a form or with a graphical view. Figure 19.13 displays the Task Sheet view with the Entry table applied. Figure 19.13. The Task Sheet view with the Entry table applied shows the same fields as a Gantt Chart view with the taskbars hidden. The Task Usage ViewThe Task Usage view displays hours of work that are to be performed by each resource on each task, laid out on a timescale. This view is particularly helpful when you're checking resource assignments on each task. Additional rows of details, such as resource availability, can be added to the right side. As shown in Figure 19.14, Task 11 is a one-week task assigned to John Melville. Figure 19.14. The Task Usage view displays exactly when work is scheduled to occur. Form Views for TasksForms are another type of nongraphical view in Project. They focus on a single task or resource at a time and provide detail or drill-down information for each one. Forms are typically placed at the bottom of a split screen view, although they can be used as full-screen displays. The basic Task Form view and its variations ”the Task Details Form view and the Task Name Form view ”are described in the following sections. The Task Form ViewThe Task Form view presents basic information about only one task in a form format (see Figure 19.15). It is possible to see more information about one task in a form view than in a standard sheet view. The Task Form view is often used in the bottom pane to display more detailed information about the task selected in the top pane. To display the Task Form view in the bottom pane, be sure a task view is onscreen, then choose Window, Split. Project places the Task Form view in the bottom pane by default. Figure 19.15. The Task Form view allows you to focus on one task at a time. The bottom portion of the form itself can be set to display a variety of project details, such as predecessors and successors, resource schedule information, work hours, and cost. In a split view, you must make the form active before you enter or edit information or choose which details to display. You can click anywhere in the form or press the F6 key to move the Active View indicator onto the form. With the form active, you can choose Format, Details or right-click anywhere on the form itself to see the available detail options. It is also possible to create custom forms if the predefined forms do not meet your needs. To display a form in a single-pane view, choose View, More Views, Task Form. Even though the task list is not visible, you can still move from one task to another by using the Previous and Next buttons . The Task Details Form ViewThe Task Details Form view, shown in Figure 19.16, is similar in format to the Task Form view, but it shows more detail at the top of the form; in particular, the fields for Current, Baseline, and Actual Dates are shown. You could use this form for tracking the progress of tasks that are already underway. Constraints are also displayed on this form, making them more obvious. As with the Task Form view, the bottom portion of the Task Details Form view can display a variety of fields and can be opened as a full-screen view. Figure 19.16. The Task Details Form view includes fields that are useful during scheduling and tracking. If the window has already been split, it probably displays the default Task Form view. You can replace the bottom view with the Task Details Form view. Make sure the form is active ”click anywhere on the form, if necessary ”before you choose View, More Views and then select the Task Details form. The Task Name Form ViewThe Task Name Form view is, as its name implies, a simple form that displays only the task name in the top portion of the form. The bottom portion of the form has the same formatting options as the Task Form view and the Task Details Form view. You access this view by choosing View, More Views, Task Name Form, and you can make it either a full-screen display or the bottom portion of a split window. The Task Name Form view is useful when it is used in the bottom pane of a combination view and you don't want to waste screen space on redundant information. Sheet Views for ResourcesTwo sheet views present resource information ”the Resource Usage view and the Resource Sheet view. They are similar to their task sheet counterparts. The Resource Usage view displays a list of resources and their task assignments, which is like a restructured Task Usage view. The Resource Sheet view has a row-and-column format that is particularly convenient for entering and reviewing resource field values from the database. These two views are discussed in the following sections. The Resource Usage ViewThe Resource Usage view, which you access through the main View menu or the View bar, is a sheet view that lists resources on the left and their allocation to tasks on a timescale on the right (see Figure 19.17). The allocation information on the right side can be set to display hours of work, hours of overallocated work, cost, available time, and other details. Resources are listed on the left, with the tasks assigned to them indented underneath. A symbol similar to the outline symbol in the task list allows you to hide or show the tasks that are assigned to the various resources. For example, in Figure 19.17 tasks for Scott Adams have been hidden; the plus symbol to the left of his name indicates that some information is not currently displayed. Figure 19.17. The Resource Usage view is helpful when resolving overallocation problems. A diamond-shaped icon with an exclamation point displays in the Indicators column for the resources that need to be leveled. When you point to this icon, a message displays, identifying the type of leveling setting that is required: day by day, week by week, and so on. This view is primarily used when resolving overallocation problems. It is particularly useful when displayed in a combination view, with the Gantt Chart view in the bottom pane to display the tasks assigned to each resource. The Resource Sheet ViewThe Resource Sheet view, shown in Figure 19.18, is a list of resource information that is displayed in familiar spreadsheet format. You access this view by choosing View, Resource Sheet, or by using the View bar, and you can use it to enter and edit data about both work resources and material resources. Each resource is in a row with fields of resource data in columns. The Indicators column displays an icon for overallocated resources. The fields that are displayed depend on the table that has been applied. (See the section "Exploring the Standard Tables," later in this chapter, for more details.) This view is most often used for creating an initial resource pool. Figure 19.18. The Resource Sheet view provides a spreadsheet format for entering and editing basic resource data. Form Views for ResourcesTwo form views focus on resources and their assignment details ”the Resource Form view and the Resource Name Form view. The only difference between these two is the amount of detail at the top of the form. There is no Resource Details form that is similar to a Task Details form. As with task forms, resource forms are typically displayed at the bottom of a combination view. To create this combination, display a resource view first, such as the Resource Sheet view, and then choose Window, Split. The Resource Form view will open automatically in the bottom pane. The Resource Form ViewDisplaying much the same information as the Resource Sheet view, the Resource Form view allows you to focus on one resource at a time (see Figure 19.19). This is the form that opens by default when a resource view is displayed and after the window is split. The information in the top portion of the Resource Form view is the same as in the Resource Sheet view. If a resource is selected in the Resource Sheet, then the details appropriate for that resource will be shown in the Resource Form View. The bottom portion of the form can be set to display a schedule of tasks to which the resource is assigned ”the hours of work that are currently assigned, including overtime, costs associated with this resource, notes, and so on. You can find these choices by choosing Format, Details or by right-clicking the displayed form. Figure 19.19. The Resource Form view displays both basic and detailed information about any resource. In this figure, the Resource Sheet is shown in the upper half of the screen and the Resource Form is displayed in the lower half of the screen. The Resource Name Form ViewSimilar to the Task Name Form view, the Resource Name Form view is a simple form that displays only the resource name in the top portion. You can format the bottom portion of this form to display a variety of fields about resources by choosing Format, Details. The Resource Graph View
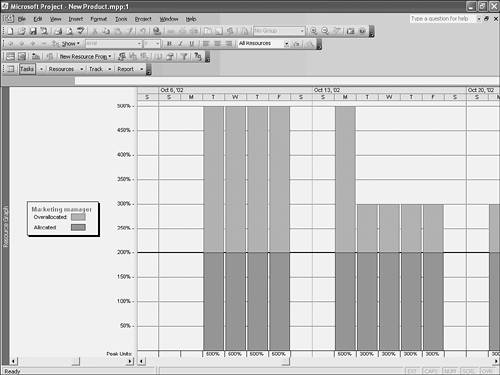
Figure 19.20. The Resource Graph view illustrates resource overallocations graphically on a timescale.
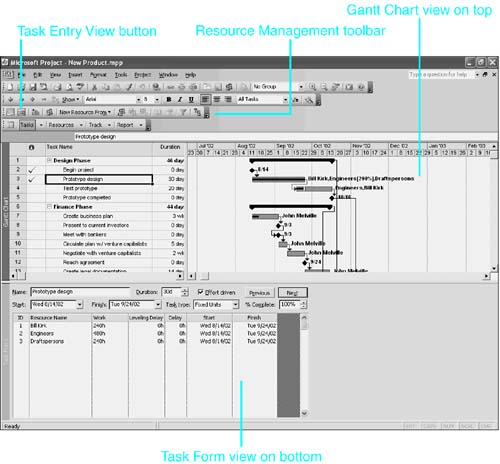
Combination ViewsSome views in Project set up a split window when they are applied. These are known as combination views because they combine predetermined views in the top and bottom of the screen. Two combination views are supplied ”the Task Entry view and the Resource Allocation view. The Task Entry View
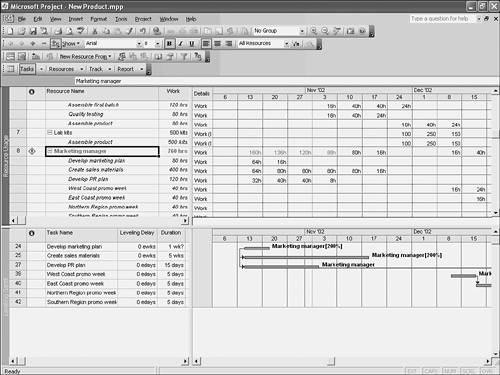
Figure 19.21. The Task Entry view offers several different perspectives on a project. CAUTION The Task Entry View button runs the ResMgmt_TaskEntry macro, which displays the Task Entry view and applies the resource schedule details for the Task Form view in the bottom pane. The details selection remains in place every time the window is split, until a different details selection is applied. The Resource Allocation ViewThe Resource Allocation view is another predefined combination view that uses views that have already been described: the Resource Usage view at the top and the Leveling Gantt view at the bottom (see Figure 19.22). As its name implies, the Resource Allocation view was designed for resolving resource overallocations. In the Resource Usage view in the top pane, you determine which resources are overallocated, during what period of time, and to what degree. In the Leveling Gantt view at the bottom, you can determine which tasks are assigned to that resource. With this information, you can make decisions about how to handle the overallocation. For example, in Figure 19.22, the top pane identifies the week of October 6 as a problem for the marketing manager. The bottom pane identifies the tasks that are assigned this manager. Each of these tasks requires the marketing manager's full attention, causing the overallocation. Having this information can help you make a wise decision about how to handle the problem. Figure 19.22. The Resource Allocation view shows when and by how much resources are overallocated, as well as what tasks the resources are assigned to during that time period.
|
 To add tasks by using the Calendar view,
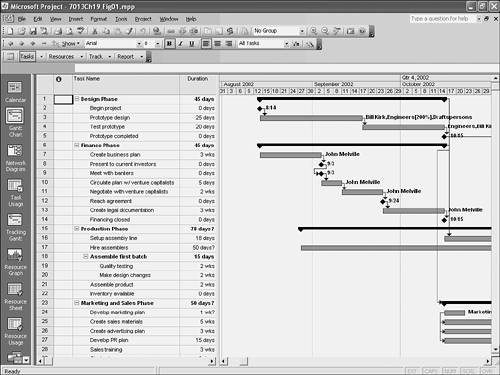
| < Day Day Up > |
EAN: 2147483647
Pages: 283