Using the Debugging Tools Available in Windows Server 2003
| Several useful tools are available in Windows Server 2003 for troubleshooting and diagnosing various problems ranging from TCP/IP connection issues to verification and maintenance issues. These tools also make it much easier for IT professionals, allowing IT personnel to focus on business improvement tasks and functions, not on simply running specific tools in the networking environment. TCP/IP ToolsTCP/IP forms the backbone of communication and transportation in Windows Server 2003. Before you can communicate between machines, TCP/IP must be configured. In Windows Server 2003, Microsoft decided to make TCP/IP install by default during the OS installation and also made it impossible to add or remove TCP/IP through the GUI. Microsoft also added four new parameters (-R, -S, -4, -6) to some of the TCP/IP utilities in Windows Server 2003 that were not available in previous versions of Windows; these parameters will be discussed next. If a TCP/IP connection fails, you need to determine the cause or point of failure. Windows Server 2003 includes some dependable and useful tools that can be used to troubleshoot connections and verify connectivity. The tools described in the following eight sections are very useful for debugging TCP/IP connectivity problems. PINGPING means Packet Internet Groper. It is used to send an Internet Control Message Protocol (ICMP) echo request and echo reply to verify the availability of a local or remote machine. You can think of PING as a utility that sends a message to another machine asking "Are you still there?" By default, in Windows Server 2003, PING sends out four ICMP packages and waits for responses back in one second. However, the number of packages sent or time to wait for responses can be changed through the options available for PING. Besides verifying the availability of a remote machine, PING can help determine a name resolution problem. To use PING, go to a command prompt and type PING Targetname, as shown in Figure 34.14. Different parameters can be used with PING. To display them, type PING /? or PING (without parameters). Figure 34.14. A PING command in a command-prompt window.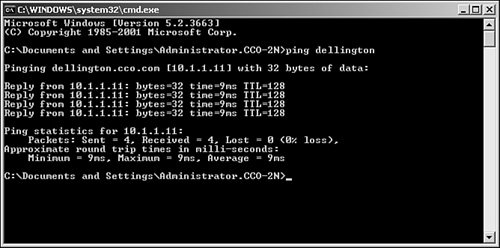 The parameters for the PING command are as follows:
Note Some remote hosts may be configured to ignore PING traffic as a method of preventing acknowledgment as a security measure. Therefore, your inability to ping a server may not necessarily mean that the server is not operational, just that the server is not responding for some reason. TracertTracert is generally used to determine the route or path taken to a destination by sending ICMP packets with varying Time to Live values. Each router the packet meets on the way decreases the value of the TTL by at least one; invariably, the TTL is a hop count. The path is determined by checking the ICMP Time Exceeded messages returned by intermediate routers. Some routers do not return Time Exceeded messages for expired TTL values and are not captured by Tracert. In such cases, asterisks are displayed for that hop. To display the different parameters that can be used with Tracert, open a command prompt and type tracert (without parameters) to display help or type tracert /?. The parameters associated with Tracert are as follows:
Note Tracert is a good utility to determine the number of hops and the latency of communications between two points. Even if an organization has an extremely high-speed connection to the Internet, if the Internet is congested or if the route a packet must follow requires forwarding the information between several routers along the way, the performance and ultimately the latency (or delay in response between servers) will cause noticeable communications delays. PathpingPathping is a route tracing tool that combines both features of PING and TRacert commands with some more information that neither of those two commands provides. Pathping is most ideal for a network with routers or multiple routes between the source and destination hosts. The Pathping command sends packets to each router on its way to a destination, and then gets results from each packet returned from the router. Because Pathping computes the loss of packets from each hop, you can easily determine which router is causing a problem in the network. To display the parameters in Pathping, open a command prompt and type Pathping /?. The parameters for the Pathping command are as follows:
IpconfigIpconfig displays all TCP/IP configuration values. It is of particular use on machines running DHCP. It is used to refresh DHCP settings and to determine which TCP/IP configuration values have been assigned by DHCP. If Ipconfig is used without parameters, it displays IP addresses, subnet masks, and gateways for adapters on a machine. The adapters can be physical network adapters or logical adapters such as dial-up connections. The parameters for Ipconfig are as follows:
Note Ipconfig determines the assigned configuration for a system such as the default gateway, DNS servers, local IP address, subnet mask, and the like. When you're debugging network problems, you can use Ipconfig to validate that the proper TCP/IP settings have been set up for a system so that a server properly communicates on the network. ArpArp stands for Address Resolution Protocol. Arp enables the display and modification of the Arp table on a local machine, which matches physical MAC addresses of machines to their corresponding IP addresses. Arp increases the speed of connection by eliminating the need to match MAC addresses with IP addresses for subsequent connections. The parameters for Arp are as follows:
NetstatAs its name implies, Netstat (or Network Statistics) is used to display protocol statistics for any active connections, monitor connections to a remote host, and monitor IP addresses or domain names of hosts with established connections. The parameters for Netstat are as follows:
NetDiagThe Network Connectivity Tester (NetDiag) tool is a command-line diagnostic tool to test network connectivity, configuration, and security. It's included with the Support Tools on the Windows Server 2003 media. The tool gathers information on and tests network configuration, network drivers, protocols, connectivity, and well-known target accessibility. This is a good tool to use right off the bat if you think there are problems with the network connectivity of a system. One nice feature of the NetDiag.exe tool is that it does not require parameters, which makes it easy to use. Simple instructions can be given to the administrators that need to execute it, and the bulk of the time can be spent analyzing the results. Although it doesn't require any parameters, there are several available:
When specifying tests to run or to skip, nonskippable tests will still be run. DCDiagThe Domain Controller Diagnostic (DCDiag) tool analyzes the state of domain controllers and services in an Active Directory forest. It is included with the Support Tools on the Windows Server 2003 media. This is a great general-purpose test tool for checking the health of an Active Directory infrastructure. Tests include domain controller connectivity, replication errors, permissions, proper roles and connectivity, and other general Active Directory health checks. It can even run nondomain controllerspecific tests, such as whether a server can be promoted to a domain controller (the DcPromo test), or register its records properly in DNS (RegisterInDNS test). DCDiag is run on domain controllers exclusively, with the exception of the DcPromo and RegisterInDNS tests. When run without any parameters, the tests will be run against the current domain controller. This runs all the key tests and is usually sufficient for most purposes. The parameters for DCDiag are as follows:
When specifying tests to run or to skip, nonskippable tests will still be run. RouteRoute is particularly useful for troubleshooting incorrect static routes or for adding a route to a route table to temporarily bypass a problem gateway. Static routes can be used in place of implicit routes specified by a default gateway. Use Route to add static routes to forward packets going to a gateway specified by default to avoid loops, improve traffic time, and so on. The parameters for Route are as follows:
NslookupNslookup is used to query DNS. You can think of Nslookup as a simple diagnostic client for DNS servers. It can operate in two modes: interactive and noninteractive. Use noninteractive mode to look up a single piece of data. To look up more than one piece of data, use interactive mode. To stop interactive mode at any time, press Ctrl+B. To exit from the command, type exit. If Nslookup is used without any parameters, it uses the default DNS name server for lookup. The parameters for Nslookup are as follows:
System Startup and RecoveryThe System Startup and Recovery utility stores system startup, system failure, and debugging information. It also controls the behavior (what to do) when a system failure occurs. To open System Startup and Recovery, right-click My Computer, select Properties, select the Advanced tab, and then click Settings under Startup and Recovery to display a property page similar to the one shown in Figure 34.15. Figure 34.15. The Startup and Recovery page. The Default Operating System field contains information that is displayed at startup. This information is typically the name of the operating system such as Microsoft Windows Server 2003 Enterprise server. You can edit this information by clicking the Edit button or by editing the boot.ini file. If the machine is dual-booted, there will be an entry for each operating system. The Time to Display List of Operating Systems option specifies the time the system takes to display the name of the operating system at startup. The default time is 30 seconds. This can be increased or reduced to a different time. You can set the action to be taken when system failure occurs in the System Failure section. There are three options. The first option is Write an Event to the System Log. This action is not available on Windows Server 2003 because this action occurs by default every time a stop error occurs. The second option, Send an Administrative Alert, sends an alert. The last option, Automatically Restart, automatically reboots the system in the event of a system failure. The Write Debugging Information section tells the system where to write debugging information when a system failure occurs. The options available include where the debugging information can be written to Small memory dump (64KB), Kernel memory dump, Complete memory dump, or (none). The Write Debugging Information To option requires a paging file on the boot volume, which should be the size of the physical RAM plus 1MB. Thus, a system with 512MB of RAM will create a paging file 513MB in size. Memory resources can be saved if the Write Debugging Information To option is set to (none) and the Send an Administrative Alert option is unchecked. The memory that would be saved depends on the server; the drivers that enable these features require about 60 to 70KB. Memory-Related DebuggingMany troubleshooting scenarios revolve around memory-related issues, such as an errant application or process consuming too much memory. The Windows Server 2003 Resource Kit provides many useful utilities that can assist in the troubleshooting process. However, there are two that are specifically designed for memory:
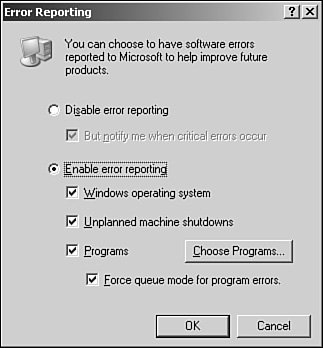
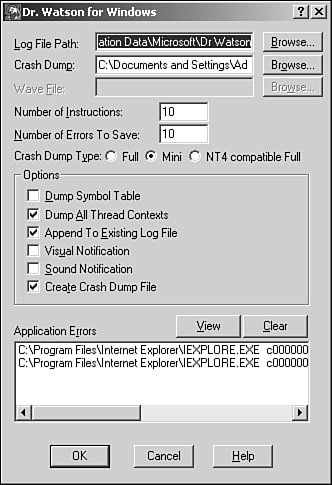
The Software Error-Reporting MechanismSoftware errors can be reported in Windows Server 2003. The error-reporting mechanism makes this happen. The errors reported in the error-reporting mechanism can be sent to Microsoft to help improve its future products. You can open this mechanism by right-clicking My Computer, selecting Properties, selecting the Advanced tab, and clicking the Error Reporting button to display a screen similar to the one in Figure 34.16. You can disable software error reporting by selecting the Disable Error Reporting radio button. Figure 34.16. Error Reporting screen. The other option is to allow software error reporting. You enable it by selecting Enable Error Reporting. Options are available to report all or one of the following: Windows Operating System, Unplanned Machine Shutdowns, Programs (you can select programs you want by clicking the Choose Programs button), and Force Queue Mode for Program Errors. Dr. Watson for WindowsDr. Watson for Windows is a program debugger. The Microsoft technical support team can use the information obtained and logged by Dr. Watson for troubleshooting purposes. A text file is generated whenever an error occurs. A crash dump file can also be generated when an error occurs. Dr. Watson starts automatically when a program error occurs. However, you can also start it from a command prompt by typing drwtsn32. After Dr. Watson is started, a screen similar to the one in Figure 34.17 is shown. Figure 34.17. Dr. Watson for Windows screen. The log file generated by Dr. Watson can be viewed in a text editor. This file contains information such as process ID of the application, date and time of occurrence, error that occurred, program that caused the error, function name, task identifier, and so on. |
 Password
 ""} Uses the supplied credentials to run the tool.
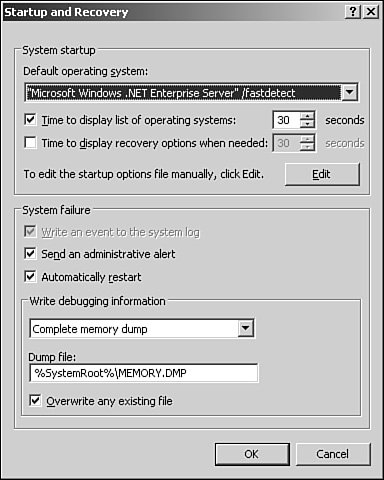
EAN: 2147483647
Pages: 499