The Value in Conquering Complexity
Overview
It all started innocently enough. About four years ago, a few of Bank One’s Wholesale Lockbox customers asked if they could use overnight delivery and get their deposits—sometimes as much as $1 million—credited quickly the following day. Bank One naturally said “No problem. We’ll give you a four-hour turnaround time. And there won’t be any charge for the service.”
And, at first, it wasn’t a problem. They’d receive a few overnight deliveries, each containing one or two items at most. But very quickly, the overnight business mushroomed. Now, many of the Wholesale Lockbox customers use this service, which may range from a single deposit to multiple deposits, and may contain anywhere from 1 to 500 checks, representing up to 200 invoices. Not only that, but a large majority of the customers wanted Bank One to follow customized procedures unique to them for processing their checks. Some of these procedures included data entry, data keying, imaging items, stapling in the left hand corner, or the right hand corner, or using paper clips, clipping sets of invoices together, and so on.
All in all, Bank One estimates its “single” overnight service actually comprised several hundred different pathways—which explains why the “four-hour delivery” promise was operationally challenging to accomplish. The complexity of the offering, and the resulting complexity of the processes, made it certain that Bank One would fail some customers eventually. They also realized that most of their competitors were charging for this premium service, but how could they consider doing that when it was difficult for them to approach 100% of their service commitments?
The solution to Bank One’s problem was multilayered. Part of the answer lie in applying some of the basic Lean principles to streamline their own internal processes. They could attempt to reduce setup times between different tasks (like the Lockheed Martin buyers), they could triage the work, etc. Making such changes allowed them to reduce WIP (the number of deposits waiting to be made), which helped improve internal process problems by reducing waste, cost, and lead time. This reduced the number of non-value-add activities, and reduced process complexity to an extent. But in the face of such a broad offering, there is a limit to how much you can reduce non-value-add costs by internal improvements in flexibility...
Thus there is another element they must attack: the complexity of the product or service offering itself. As shown in Chapter 4, such external complexity (the variety of products and services) that is often thrown at a process creates even more things-in-process (WIP) and hence non-value-add cost than do internal process problems (e.g., setup time).
The Lockbox group at Bank One is well on its way towards their ideal solution. Improving their processes, and understanding exactly what service levels they could commit to, has made it possible for them to convert this overhead-consuming service into one that generates revenue and consistently satisfies customer expectations. The process is now performing to industry standards and is improving every month. There is still a lot of complexity with the services subsumed under the Lockbox system, but now they understand the source and impact of that complexity, and are able to charge variable fees accordingly. And the group has embarked on an initiative to create cellular/modular processing—a “platform” approach to complexity reduction in services discussed later in this chapter. (You can also find more details of this case in Chp 13.)
The purpose of this chapter is to expose the insidious nature of complexity, and arm you with the knowledge you need to make rational strategic decisions that will allow your organization to still differentiate itself in the market without being consumed by non-value-add complexity costs.
Many of the examples in this chapter come from manufacturing companies because complexity reduction inside service companies is in its infancy. But the principles involved apply equally whether your company is making widgets or providing a service. (And, in fact, if you read closely, you’ll see that the source of product complexity from the manufacturing companies we’ll cover are the result of services inside those companies—especially marketing and product development.) Whatever your business, the payoffs of eliminating unnecessary complexity often dwarf those of Lean and Six Sigma taken separately.
Face to Face with the Cost of Complexity
My intense interest in reducing, and specifically computing, the cost of complexity is borne of experience that was bought, not taught. I was formerly the CEO of International Power Machines (IPM), which I founded, took public, and subsequently sold to a division of Rolls-Royce. The company designed and produced Uninterruptible Power Supplies (UPS) that protect critical computers and instrumentation from AC power failures. Our systems protected the computers of the NYSE, Depository Trust, Merrill-Lynch, and nuclear power plants, to name but a few applications.
IPM began with just one product offering, a 5 kilowatt unit. Then, like most companies in this market, we started developing additional power units (10kw, 20kw… and ultimately 300kw) to satisfy the needs of customers. Over the years, this drive to grow our power ratings had resulted in seven separate mechanical and electrical designs in just the 10–80kw range, with virtually no parts in common between different power ratings. Being able to satisfy the needs of customers requiring different power ratings is value-add complexity; needing seven sets of electrical designs each with unique components to do it is non-value-add complexity (also known as “transparent complexity”). Our customers derived no particular value out of the variety of parts such as “bus bars” or “heat sinks” that were used. Because of complexity, any effort that engineering and manufacturing applied to one rating created very little learning that could be applied to another rating. Our manufacturing processes were also complex (and expensive), dominated by the assembly of a vast profusion of subassemblies going into an unlimited number of final assemblies.
We tried in vain to find a “vital few” causes that would explain our high costs, quality problems, and long lead times, but the Pareto charts were flat. The company was flirting with insolvency and had massive quality problems in the field, unhappy customers, and little revenue growth.
Product Development s Role in Complexity Reduction
The units from 10–80 kilowatts generated 15% Gross Profit Margin and a negative return on capital. As the company grew, overhead costs grew in proportion to volume. We had to increase our invested capital by borrowing.
“Depend upon it, when a man knows he is going to be hung within a month, it concentrates the mind wondrufly”
Dr. Samuel Johnson
In desperation, I went to the public library and read, among other things, about Toyota’s drive to make many different customer-facing products and option “packages” out of a small number of standardized subassemblies. The cost-benefits reported were amazing. But I also read of the disaster caused by the “look alike” cars that GM was producing, as their approach to cost reduction. Clearly the best approach was to standardize internal processes yet satisfy a variety of customer needs at low cost.
What options did we have? There were two paths. We could attack the complexity directly through standardization using Design for Lean Six Sigma (DFLSS) tools in service/product development (with no impact on the customer), or we could try to improve our process quality by applying the Lean Six Sigma tool, with the goal of becoming more flexible and efficient despite our internal non-value-add complexity.
Our internal manufacturing processes were primarily assembly, with small setup times. So there didn’t seem to be much potential in applying Lean Six Sigma to the manufacturing application. And our main quality defects—mis-wiring or mis-assembly of products—were related to the huge number of different products we offered (i.e., product complexity). Therefore it seemed that complexity reduction was our best path, as depicted in Figure 5.1 (next page).
Figure 5.1: Standardization Reduces NVA Costs Far More Than Lean or Six Sigma
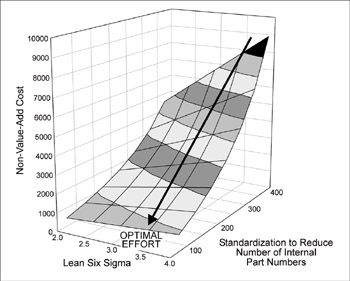
One of the author’s previous companies faced the same situation that Stanford faced: they could achieve greater reductions in cost and improvement in speed by reducing complexity than by simply trying to improve the processes in their current state.
In our cases, standardization—and, more precisely, platform standardization—meant developing a common mechanical and electrical design across a range of power ratings. In fact, we reached a point where more than 80% of the components, subassemblies, and wiring were common to all products.
Other changes ensued. For example, we concluded that the systems for nuclear plants—which were entirely custom made—had complexity costs hidden from accounting, and we withdrew from that market. Production lead times, originally in a range of 6 to 12 weeks, fell to less than 2 weeks. The quality of the product improved dramatically—an unexpected benefit. (Any improvement efforts attempted prior to standardization would likely have proven ineffective since they’d be diffused over many designs. But post-standardization, we could focus our efforts like a laser on one mechanical design.)
With common wiring tables, the units would go into the lab and come up and run immediately, greatly reducing testing, documentation, and engineering costs. Reliability in the field showed similar improvement, which reduced warranty costs. In fact, we used our improved reliability as a competitive weapon: customers were promised their money back if they didn’t like the performance. At the time, nobody else dared make that offer.
Moving to platform standardization also opened up new markets for us. Because of the unreliability of foreign power, our quality problems, and tariff duties, we’d had limited sales abroad. However, the standardized product was so simple to assemble and so well-documented that we exported the high-value-add subassemblies, licensing local firms to add local content transformers, cabinets, etc., to reduce tariffs. It was a proud moment when these subassemblies, shipped halfway around the world, also started up and ran perfectly. In the midst of all our past quality problems, this had been my goal.
I had recalled a passage from Ernest Hemingway’s For Whom the Bell Tolls:
“His eyes, watching the planes coming were very proud…and he watched their steady, stately, roaring advance… They had come, crated on ships, from the Black Sea, through the Straits of Marmora, through the Dardanelles, through the Mediterranean and to here, unloaded lovingly at Alicante, assembled ably, tested, and found perfect!…his eyes were hard and proud…this was how it could be!”
And this is how it became. Marketing productivity grew with our reputation, as we won a larger percentage of opportunities. By suitable redesign, all mechanical designs were combined into one all the way to 200kw. This eliminated the costs associated with WIP, the learning curves and related non-value-add costs, which resulted in an increase in Gross Profit Margin from 15% to 37% (see Table 5.1 and Figure 5.2). ROIC was driven from –6% to +30%, and the company was eventually sold to a division of Rolls Royce for 7.2 times book value. This gave me the resources and time to finally visit Toyota and other Japanese firms, and subsequently to found the George Group.
|
Year |
1 |
2 |
3 |
4 |
|---|---|---|---|---|
|
Gross Profit* |
18% |
25% |
31% |
37% |
|
Operating Profit* |
-3% |
6% |
17% |
20% |
(* as % of revenue; ref. SEC Registration 2-68861).
Figure 5.2: Standardization Improves Profit Margin
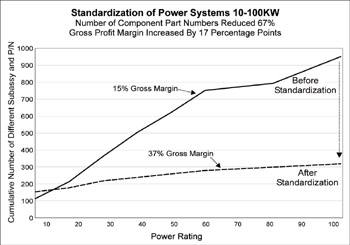
The upper line on this graph shows the huge impact of the cumulative effect of multiple options and unique designs for each power rating. Once the internal components were standardized, the cumulative number of parts dropped, and gross margin more than doubled.
In short, we discovered that the service functions that created complexity were marketing strategy and product development execution. Manufacturing and Testing were simply the innocent victims that got the blame.
The concept of complexity reduction is depicted graphically in Figure 5.3 (below).
Figure 5.3: The Path to Complexity Reduction
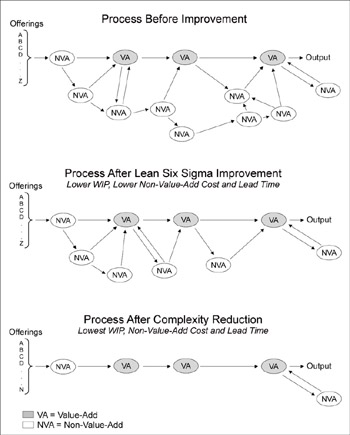
The first panel shows an unimproved process. The second panel shows the application of all the traditional Lean Six Sigma DMAIC tools, such as Pull systems, setup reduction, process control, designed experiments, etc. Note that the number on non-value-add activities in the process has been reduced by nearly 50%, as has the work-in-process (WIP) and lead time. However, by cutting the number of different tasks that each activity must perform, further dramatic reduction in non-value-add activities, WIP, and lead time can be achieved. The method of calculating the benefits of complexity reduction has long been one of our goals, and one that is discussed later in this chapter.
The Forces Driving Increased Service Product Complexity
For the past 80 years, the operating thesis in business has been that you have to offer customers any options they want (= high offering complexity) as the path to differentiated product/service lines, and hence to high profits. The origins of this premise—and the strong belief in the value of complexity—lie in the industrial struggles of the early 20th century, as exemplified by the classic story of the demise of the Model T.
In 1921, the Ford Model T commanded over 60% of the low-cost market and appeared impregnable. In his book My Years with General Motors, Alfred Sloane recalls that dark time, as GM teetered on the brink of bankruptcy:
“To compete head on with Ford would have required the resources of the U.S. Treasury.”
But as Sloane saw it, the Model T had served the early market’s need for utility transportation. Available in only one style and color, the T defined the extreme limit of mass production and was the antithesis of product complexity. Soon, this utilitarian need would be furnished by the rising tide of used Model Ts. Sloane reasoned that the strength of the economy in the 1920s would lead many owners of the Model T to want to buy a better car, priced slightly higher, but available in different colors, offering a better ride, more power, etc. To meet this projected demand, all effort was focused on correcting Chevrolet’s quality problems—to the exclusion of other development efforts (such as developing the type of air-cooled engine that would later bring Porsche fame)—and on creating an offering with many desirable options.
In other words, GM was differentiating the company in the market by offering a wider variety of choices to consumers. By 1925, the strategy was working, writes Sloane—“Ford’s precious volume, upon which all depended, started falling”—and by 1928 the Model T was driven from the market.
The concept of a single product with no options justifiably entered the dustbin of history, and the unfettered pursuit of differentiation began.
The result? Fast forward 80 years. The costs of product and offering complexity are generally unknown inside a company, let alone shared with the outside… unless a catastrophic market change forces action. We have had such a rare event in the airline industry. American Airlines has been “mired near the bottom of air transport ratings for three years,” falling short on Critical-to-Quality needs such as on-time departure. Ralph Richardi, VP of Operations Planning remarked: “We studied every departure delay by city, by time and we didn’t find one thing that was causing the delay. It was tough to figure out. Well what was it?”
The answer, American says, wasn’t in its scheduling or staffing of flights. The underlying problem was its complexity. American had been trying to build a differentiated service offering by customizing its aircraft configurations into 30 “subfleets” to separately service each market and optimize costs. They were up to 14 different types of airplanes, including some 757s with life rafts (for overseas flights), some without; some MD80s with 20 First Class seats, others with only 14; Fokker F-100s, and so on.
Was that complexity really serving American and its customers well? Judge for yourself: They had to train mechanics in maintenance and repairs on 14 types of aircraft, with the associated “learning curve cost” (people have a harder time remembering and getting good at tasks they perform infrequently). Having to stock spare parts for 14 different types of planes not only increased inventory overhead and capital investment, but meant that they were far more likely to encounter shortages, which created delays.
What happened to the air-cooled engine?
Porsche was in difficult straits in the 1990s. Dr. Ferdinand Porsche had been the first to develop the type of robust air-cooled engine that GM had abandoned in the 1920s, creating the early Porsche mystique of high performance. However, Porsche also manufactured a line of super-high performance water-cooled models. The company had so many different models that a frontal attack (using Lean tools) on such a broad front would have a very slow rate of improvement of cost. A fateful decision was made: Porsche would abandon the air cooled engine. (A similar emotional wrench would occur if, say, Xerox got out of copiers.) This difficult decision, resulting in less complexity and focused improvement efforts, contributed to the renewed financial health of the company.
The realization of all the costs associated with American’s market differentiation strategy and resulting complexity lead its president, Gerard Arpey, to remark: “The cost of complexity isn’t offset by what you can charge. Complexity creates opportunities for you to fail your customer.”
American then reduced the number of different types of aircraft from 14 to 7, moved mechanics closer to the planes, and made a host of other changes that contributed to better flow. On-time performance ranking improved from fifth to second, and customer complaints were cut in half in just 18 months. But is this enough? Southwest, with one aircraft type, shows the cost dominance conveyed by low complexity.
Companies must balance two opposing forces: the Force of the Market, which drives complexity up through pressure to introduce new services/products and broadening of the offering; and the Force of Complexity, which mandates a simplification of the offering and associated internal complexity due to cost pressures. The optimal point is the one that maximizes EP. As companies allow levels of complexity to become too great, they risk becoming non-competitive on cost. But if they simplify their offerings excessively, they risk sudden loss of market share as customer demands shift (because they are non-diversified).
The benefits of conquering complexity hit both revenues and costs: Value optimizing the portfolio enables higher focus and sales force effectiveness, and it removes the cost associated with low-EP products. Internal standardization impacts cost by increasing the productivity of labor with a faster learning curve, as well as lowering unit costs in areas such as warehousing, purchasing, etc.
Impact of Complexity on Revenue Growth
But cost is not the only lever. Excessive complexity in your offering can also be a barrier to growth. Look at any high-complexity company, and you’ll often hear its customers saying, “They’re hard to do business with.” This reaction can be the result of several things:
- Customers having to negotiate through your complexity. If your company has a lot of different service/product offerings, each with lots of options, that complexity is transferred to customers, who are forced to navigate their way through bloated processes, reams of non-value-add offerings, etc., to find the one or two key products or services that meet their specifications. (This is an application of Little’s Law applied to customers: Customer Decision Period = Decisions in Process/Completion rate.) Reasonable people tend to want to give at least a modicum of attention to every decision; thereby transferring complexity to the customer selection process is burdening them with a bloated decision period—and lengthening the time period (before close) during which they might change their mind!
- Ineffective sales processes. The second impact on growth is played out internally. It boils down to this: Focus. And it is best demonstrated through the example of a client’s sales force. We saw an example of this in the triaging of the marketing quotation process in Chapter 2. Effectively, opportunities in which the company was competitively disadvantaged, had a poor GPM, and were very difficult to quote moved to the bottom of the queue in Figure 2.4, and effectively were never input to marketing. This is a Darwinian approach to reduction of offering complexity. The same result can be achieved far faster and more effectively by the complexity value stream analysis process.
Impact of Complexity on Organizational Effectiveness
As the discussion above has shown, complexity impacts both the top and bottom line. And it also impacts management effectiveness. In fact, the greater the complexity, the less focused management is, and the less likely they are to be in a position to understand, let alone conquer, complexity. A vicious cycle! The way to break this is by understanding the key cost drivers of complexity and focusing resources using the Pareto principle.
The examples given in this chapter and in Chapter 4 have shown how complexity is a driver of non-value-add cost. In fact, complexity is often the greatest single determinant in this category of cost. Removing “excessive” offerings that do not meet their cost of capital will carve out far greater savings than simply optimizing the process for delivering these offerings. Standardizing the “subcomponents” via standardization and modularization—whether the offering be mortgage applications, widgets, or consulting services—has a similar effect without impacting what the customer sees. In both cases, reducing the complexity can improve the cost competitiveness of an organization by a magnitude.
How Can We Conquer Complexity?
As described above, from 1908-1921, Ford’s single mass market product met the Voice of the Customer. Sloan’s “product for every purse” met the VOC for 1922-1929 while avoiding the excess complexity and cost of the “fancy class” (e.g., Pierce Arrow) with positive consequences for economic profit.
Financial services is an industry that has evolved to meet complex customer needs and wants from the early days of individual savings accounts to the complex financial instruments available today. The big winners in today’s financial services markets are those that can optimize the degree of complexity to align with customer tastes. For example, a major commercial and investment bank that for decades operated as a “universal bank” in its home market—offering all things to all people—over the last decade found that countless competitors were cherrypicking the most profitable customers and segments, leaving this bank with the most unprofitable customers and segments and high overhead cost.
But many companies, like American Airlines, are suffering from too much complexity. At some point in their histories, advanced technology companies like 3M, HP, and IBM have all stressed differentiation and created a corporate culture that put a premium on a high velocity of new product introductions. Annual reports would proclaim that “30% of our revenue comes from products that did not exist three years ago” without any discussion of standardization, or of elimination of slow moving offerings. Things aren’t any better in the service sector. How many different service options does your telephone or wireless provider offer that weren’t available five years ago? How many more services does your financial services company offer now compared to ten years ago?
The problem, as both Bank One and American Airlines discovered, is twofold:
- First, differentiation dramatically increased their non-value-add costs.
- Second, because they were internally overwhelmed in dealing with their service complexity, neither of them really succeeded in achieving market differentiation. They never created a franchise; at best, it allowed them to stay even with the competition.
In addition, they are in immense strategic risk when faced by a less-complex competitor.
These lessons put businesses in a tough spot. On the one hand, they can’t ignore the need to constantly add new services and products into the market to create competitive advantage. And to the extent that new products are needed to meet the Voice of the Customer and earn adequate ROIC, there is no disagreement. But if no corresponding effort is made to reduce complexity of offerings which do not meet these criteria, the benefits of new products or services may never see the bottom line.
Strategies for Reducing Complexity
The IPM case told above illustrated the first of two approaches to reducing complexity; here’s a quick overview of them both:
- Standardization: Standardizing and modularizing the internal tasks and components of an offering so that a fewer number of them can be assembled into many different services/products that respond to the Voice of the Customer
- Optimization: Eliminating those offerings that generate sustained negative economic profit, particularly where you are strategically disadvantaged or in a declining market
Strategy #1 Standardization Market responsiveness at low cost
The two functions that have the biggest impact on your costs of service/product complexity are marketing and R&D (or any comparable service/product development department). While a lot of complexity is related to the historical evolution of an offering, trying to redesign services or products is an expensive business.
Math is a good thing, arm waving is not
You have all read arm-waving discussions about the evils of complexity and the benefits of a narrow service/product line. But in fact restricting yourself to a narrow service/product line cuts off revenue growth opportunities. The waste equation introduced in Chapter 4 (and repeated below) is what lets us add some rigor to the argument.
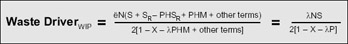
If you haven’t had to analyze equations anytime recently, you may not readily pick up on the key features of this equation. For thing, a complex offering (meaning “N” in the equation is large) is indeed very bad if you do not reduce setup time between tasks by…
- Standardizing different internal tasks. Think of this as trying to create a Lego™-like service or product, where basic components can be combined to create a cornucopia of final offerings.
- Reducing setup time between the (now-fewer number of) standardized tasks to near zero, as in the procurement example. Since your employees will now have fewer different tasks to remember, they can get more proficient at the remaining “Lego” components.
Both of these subjects are discussed at length in this chapter.
Also, as setup time (S) is reduced to zero, the WIP and effective cost of complexity falls to zero. This is absolutely true in service applications, and approximately true in manufacturing.
Thirdly, the defect percentage (x) enters insidiously into the denominator. That means as x increases, (1-x) will decrease and the work-in-process will explode. I don’t want to underestimate the challenges of standardization and setup time reduction, and defect prevention, etc. But the complexity value stream mapping process introduced in Chapter 4 turns arm-waving arguments into a rational means of making investments. So on the subject of complexity, and for the same reason, we agree with Napoleon:
“He took eagerly to mathematics, here was a discipline congenial to his demand for clarity and exactness, something beyond prejudice and argument.”
The principle of standardization is illustrated by the IPM experience described previously: we reduced non-value-add (transparent) complexity by condensing eight separate engineering designs into one design. The new single design is called a platform. Standardization has the merit of making breakthrough cost reductions without eliminating any customer facing products or services.
What is a platform? Any offering, be it a product or service, generally consists of different parts—physical subcomponents of manufactured goods, or different subprocesses in a service. (In service applications, the issue is often shared web pages, training, common software applications, and so on.) The goal is to standardize these components and the processes used to deliver them. The component platforms can then be added together to make a vast profusion of offerings for the marketplace at low cost. (In training, this principle is demonstrated by asking participants to build a number of final products using either custom parts created for different purposes or using standardized LegoTM blocks. Though the latter come in only a limited number of shapes and sizes, they can be combined in countless ways.)
The first step is to reduce the number of internal tasks to the minimum by standardization, then to reduce the setup time between these tasks to the minimum (using the Four Step Rapid Setup method, described in Chapter 11), eliminate defects, and so on.
In many cases, the total number of tasks can be reduced to one task, eliminating all setups. The benefits of this form of standardization were also illustrated by the example from Stanford Hospital and Clinics described in Chapter 1. As you may recall, they had a lot of non-value-add costs in their coronary artery bypass graft (CABG) surgery because each of six surgeons had his/her own special tray of instruments for different types of surgeries. After one afternoon of discussion among all the surgeons, they were able to settle on two basic surgical trays, which dramatically cut material costs. (In Lean terms, the two types of trays became the platforms.)
Clearly, standardization of the trays had a lot more impact than trying to train the nurses to more efficiently prepare 12 different types of trays. This is depicted by the Complexity Value Stream calculations that are graphed in Figure 5.4.
Figure 5.4: Complexity Reduction at Stanford Hospital
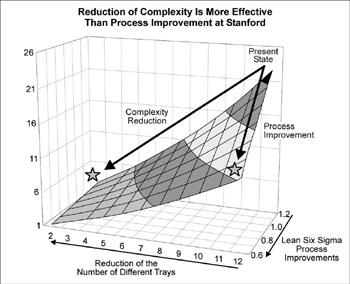
Stanford could have chosen to simply improve the quality of its “surgical tray preparation process,” but that would not have generated as much cost savings as reducing the number of trays.
This chart was prepared based on data from Stanford Hospital and Clinics. Initially, they had 12 different types of surgical trays to prepare (counting different trays for different surgeons and different surgeries). One option would have been for Stanford to simply use basic process improvement techniques to improve procedures for prepping all 12 trays. The alternative was complexity reduction: getting the surgeons to agree on standard trays. As you can see, complexity reduction had a much greater impact on reducing costs than process improvements alone could have accomplished.
There’s another part to the story that wasn’t covered in Chapter 1: Originally, Stanford had as many as eight vendors for various supplies, including surgical instruments. Led by their supplies manager, Stanford was able to settle on just two vendors for everything from defibrillators and pacemakers to sutures. From 2001 to 2002, this change saved them over $25 million. The key factors in their savings were:
- Standardizing the surgical tray options. They now purchase much higher volumes (about a six-fold increase) of far fewer parts.
- Compressing the supply base to two suppliers per part (which further increases volumes purchased at each supplier).
- Reducing labor costs. After standardization, hospital staff were preparing higher volumes of just two types of trays, rather than having to switch trays all the time, check individual surgeon preferences, and so on. This moves the processing time per unit down and reduces “learning curve” delays.
Prevention of Non-Value-Add Cost
“An ounce of platform prevention is worth a pound of standardization cure”
We have spent a lot of time finding, classifying, and eliminating non-value-add cost. The goal of this process is to transition managers and all employees to prevention of non-value-add cost by designing future offerings from standardized “Lego”TM tasks with zero setup time between tasks. But to make this transition, we first build capability by tackling an existing process which has high value potential. The reason that standardization has received so little investment is that managers:
- Underestimated the benefits (which the complexity value stream calculations address)
- Worried about the expense and disruptions of trying to standardize existing product/service lines
The first of these issues was addressed in Chapter 4: reducing complexity can often provide a greater increase in ROIC than applying Lean or Six Sigma tools to improve existing processes. The second issue has to be acknowledged and dealt with: it’s true that if you want to standardize a product or service, you will have to define a cutover date for the change and coordinate with customers well in advance of the change.
The best way to address the cost of redevelopment is to avoid it altogether—that is, incorporate standardization (platform thinking) into your development and marketing decisions as a new product or service is being designed, long before it affects what the rest of the organization does and what customers expect.
The standardization process achieves low cost without the market penalties that an optimization strategy (i.e., having to eliminate existing prod ucts or services) may suffer. You should be aware there is a certain amount of extra cost required to conceive and establish a platform strategy, so it clearly doesn’t work if you are only going to build one product or offer one type of service. But if you have more than one product/service in a family, the economics of the platform strategy quickly become a critical success factor (see Figure 5.5).
Figure 5.5: The Benefit of Platform Standardization
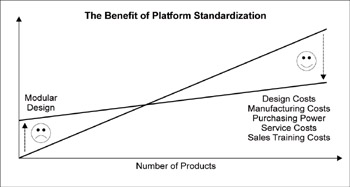
As in Figure 5.2, the costs of complexity soar as the variety of offerings increases. Standardizing the components used to delivery those offerings—platform standardization—can allow a company to maintain its offering complexity but reduce the associated costs.
By increasing the number of commodities on purchase agreement, Lockheed Martin effectively standardized the task of placing purchase orders to “point and click” for most items. The number of different items didn’t change—the internal clients could still get the products they wanted—but the process of placing orders was made identical across more products. The large variation in the time it took to place an order was reduced, with important reductions in queue time and hence WIP.
Standardization and the accidental invention of the microprocessor
In 1969, Intel was approached by a Japanese calculator company to produce a dozen special-purpose chips. Because Intel’s resources were so slender, they decided to build a general-purpose chip that could perform all 12 functions, and be produced in 12 times the volume at lower cost. Out of this intelligent effort to reduce complexity was born the 4000 Series microprocessor, the first ever produced worldwide. This is an example of the “platform” concept discussed above, and what a boon this “accidental empire “ has been to the world! Indeed, as Andy Grove pointed out in his book Only the Paranoid Survive, Intel would have been destroyed if it had not abandoned its primary business (memory chips) and made the leap to microprocessors. Yet they agonized over this decision for a year, fearing customer reaction. When the event happened, the customers by and large were only surprised it had taken so long!
Strategy #2 Product Service Line Optimization
Despite the best attempts to reduce costs, your organization will likely have some services or products that are unlikely to ever earn an ROIC greater than the cost of capital (as discussed with the 5-brand-line company depicted in Figure 4.3). These services/products should be removed from the offering or re-priced to attain an adequate return. This optimization may result in short-term loss of revenue and is often resisted, but can be very effective in lowering costs and providing customers with a higher value product or service. The fact is that these products and services, with allowance for overhead absorption, are destroying value in the business. They either have to be improved in cost or eliminated in a way that will not create customer hostility.
Complexity standardization that simply eliminates non-value-add complexity can be executed once the costs and values are known. But products and services whose features and functions are desired by the customer, i.e., non-transparent, require thoughtful consideration before they can be cut from the offering. The elimination of products or services which do not add to shareholder value must be balanced against customer relationships, the company strategy, the impact on internal processes, and the improvement in economic profit. The goal is to identify a desired “future state” fixed cost position and create a supporting strategy and Lean Six Sigma implementation to achieve it.
The strategy of the company may require the optimization (removal) of certain services/products, and thus enable a more intense focus on standardization and process improvement to improve performance of the remaining offerings. The board of one company was faced with just such a decision: exit a large product market where it was disadvantaged, or attack with standardization and process improvement. In this case, they were able to radically improve their competitive cost position through standardization alone.
Application: Marketing’s role in reducing the cost of complexity
In every company, service or manufacturing, marketing rightly views its role as growing revenue. The natural assumption is that if you’re applying good Six Sigma thinking, and listening to the Voice of the Customer, you should be OK in the market. However, a company ought to calculate ROIC by customer. If you are not earning your cost of capital from a customer or customer segment, and can’t formulate a strategy to do so, you need to gracefully withdraw. As noted above, by withdrawing some offerings, you are able to focus Lean Six Sigma efforts on a smaller range of offerings with much greater impact.
Figure 5.6: Using Optimization to Reduce Product Breadth, then Lean Six Sigma for Process Improvement
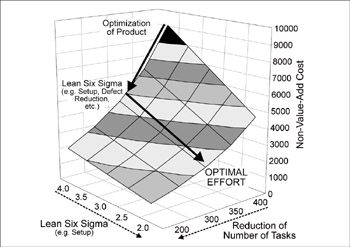
As demonstrated by Table 5.2 and this figure, the optimal path to increasing ROIC is to sometimes eliminate offerings, then attack the remaining services/processes with traditional Lean Six Sigma tools.
|
Operating margin |
From 5.4% to 13.8% |
Capital turnover |
From 2.8 to 3.7 |
|
ROIC |
From 10% to 33% |
Enterprise value |
Increased 225% |
|
EBITDA |
Increased 300% |
Economic Profit |
From –2% to 21% |
|
Lead time |
From 14 days to 8 days |
On-time delivery |
From 80% to >99% |
|
Quality performance |
From 3s to 6s |
Optimizing it’s product line—eliminating some under-performing products—allowed this company to focus it simprovement efforts on higher-value offerings. The company increased its shareholder value, and having been sold at book value once was sold at 3.6 times book just 26 months later.
Historically, there was no such check on marketing or product development plans. In fact, the slow rate of improvement in reducing manufacturing overhead cost is often due to excess complexity inflicted by marketing.
As an example, a former division of United Technologies Automotive produced coupled hose and fittings for brakes and air conditioners. The division was barely earning its cost of capital. It produced 168 different types of coupled hose products principally for Ford and Chrysler, with smaller production for Toyota and International Truck. Opportunities at Ford and Chrysler abounded if the company could reduce lead times from 12 days to 3 days. The earnings on sales from Toyota and International were running below its cost of capital and no credible plan could be devised to make them into value creators, so they were removed from the product line. This removed two very demanding clients from the backlog who had defocused both engineering and manufacturing engineering improvement.
Though this example deals with product complexity, it is not a manufacturing issue; it requires management and marketing to take the initiative to reduce the costs imposed by offering complexity. Complexity reduction is definitely a strategic and cross-functional endeavor.
Thus the initial reduction of complexity in the product line enabled a focused Lean Six Sigma effort. Internal product complexity on products for Ford and Chrysler was relatively fixed by the qualification testing requirements. Redesign to standardize components thus required a long and costly cycle time. So a Lean Six Sigma assault was launched on the optimized product lines. Because they could deliver within three days (= reduce lead time), the company more than doubled sales to Ford, doubling company revenue. The principal sources of non-value-add cost, manufacturing overhead and quality cost, were reduced by 22%. This is an example where a diagnostic would have revealed that the major ROIC opportunity lay in Lean Six Sigma process improvement if the company could be freed from complexity. The results of application of Lean Six Sigma was quite dramatic (see Table 5.2).[1]
Often, the right answer is to pursue standardization and/or optimization and then pursue process improvement. Data from one company that used optimization to reduce the number of its offerings was used to generate Figure 5.6 [next page]; this company went on to use process improvement to lower costs in its remaining offerings.
Sometimes, all the standardization or process improvements in the world can’t help service or product lines become profitable. In the situation shown here, this company realized that they would be better off eliminating several service lines (“optimization”) then focusing its improvement efforts in the remaining areas.
Figure 5.7: Impact of WIP on Non-Value-Add Costs
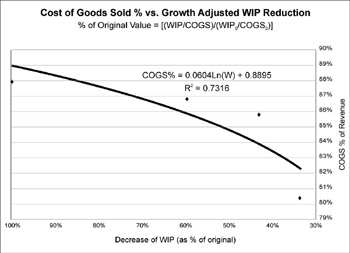
The relationship between WIP and non-value-add costs is logarithmic, not linear. That is,the rate at which non-value-add costs drop increases with incremental reductions in WIP. This chart actually focuses on the reverse situation: as WIP is cut from its original level (the 100% value, left side of graph) there is a much greater drop in non-value-add cost. The costs really dive down when WIP is cut to 30% of its original value because many costs are quantized, and a lot of WIP has to be eliminated before these costs can be reduced. Reductions also depend on management decisions, and the opportunity to move non-value-add and personnel to value-add jobs.
[1]See www.profisight.com for calculations.
Calculating the Cost of Complexity
Complexity adds cost on many levels, but the two major drivers are related to the amount of work-in-process (WIP) and the lower productivity that complexity creates. We can estimate these figures using data taken from the Waste Driver equation calculations described in Chapter 4 (where it was used to generate a complexity value stream map). The output from those calculations will reveal:
Excess WIP: A fundamental Lean principal is that long setup time creates large amounts of work- or things- in-process (WIP), and that large WIP creates non-value-add cost activities such as rework, lost customers, expediting, etc. As the formula on page 157 and Figure 4.11 show, complexity of the offering actually increases WIP more than does setup time. Let’s say that you offered three product families and had 1500 things-in-process. If the total volume transactions was constant but now those three only accounted for 80% of demand, there were, say, 13 other offerings that accounted for the remaining 20% of demand, how much would the WIP increase? 300%! Non-value-add cost is a log function of WIP, the proportionality factors are determined during complexity value stream mapping.
Traditional accounting would suggest that those 13 additional offerings have to be priced to pay for all the increase in cost, or else they will have low ROIC and destroy shareholder value. The alternative is to eliminate these 13 offerings from the product line, which could lead to major loss of customer goodwill and revenue. However, knowing the cost of complexity as determined by the complexity value stream map, managers can now make rational investments in standardization, setup reduction, etc., to preserve variety at low cost and positive economic profit. The equations show that, if you preserved all 16 offerings, but reduced the setup time by 67%, you would have the same cost as if you only had the 3 high volume parts! And if you could standardize the 13 to a lesser number, costs would be even lower. (For clarity, we have assumed no defects, downtime, etc., in this analysis, but they are easily added.)[2]
Low productivity: The more the complexity, the less frequently a given task is repeated, and the higher the value-add activities are on the learning curve (and hence higher cost). In addition to low cumulative volume, people’s knowledge of how to perform the task decays the longer the period between repetitions. Both of these factors drive higher cost. As we have seen, standardization is the key antidote to low productivity.
Both of these costs can be estimated from the Waste equation, which provides a rational foundation for making an investment in complexity reduction.
Complexity reduction effectively reduces costs related to work-in-process and low productivity. A graph of the United Technologies, shown below, illustrates the logarithmic relation of WIP to non-value-add cost. (See Figure 5.7) Lead time (and WIP) should be reduced to low levels to eliminate non-value-add costs. (Interestingly, that level is generally far lower than what is demanded by the customer.)
[2]Ibid.
Conclusion
For most companies, the hidden cost of complexity represents a hidden profit pool that provides an important new avenue for value creation. The cost of complexity can be conquered first by internal standardization, and then by application of Lean Six Sigma tools such as setup reduction and defect prevention on the reduced number of tasks. Ultimately, some offerings cannot be transformed into positive economic profit contributors to shareholder value, and must be optimized out of the offering. Sometimes optimization is the strategy.
You can experience the power of complexity reduction through optimization simply by walking into any Wal-Mart or Sam’s Club. Just compare the number of types of toothpaste at Sam’s to your local supermarket or drug store, and you’ll see how they are using optimization as a competitive strategy. Sam’s is able to drive enormous volume through a few SKUs (Stock Keeping Units). This gives them huge buying power over their suppliers, much lower store space cost per unit, lower labor cost to stock, etc. Suppliers are not paid until the goods are sold, allowing Sam to work with negative working capital just as Henry Ford did. Much of Sam’s savings is passed on to the consumer to gain market share, to “preserve precious volume on which all depends.” But unlike Ford, Sam’s products are satisfactory to at least 68% (= 1 sigma) of the population as a whole. Within this population, Sam has effectively created a franchise—people go to Sam’s because it is often the only source of low-cost goods that meet their needs. It can be argued that Sam’s and Southwest Airlines’ whole strategy is built upon complexity reduction.
Complexity reduction, through internal standardization, Lean Six Sigma improvements, and then through optimization offers enormous competitive advantage. Think of complexity reduction as a new competitive weapon and a potent tool to increase shareholder value.
Part I - Using Lean Six Sigma for Strategic Advantage in Service
- The ROI of Lean Six Sigma for Services
- Getting Faster to Get Better Why You Need Both Lean and Six Sigma
- Success Story #1 Lockheed Martin Creating a New Legacy
- Seeing Services Through Your Customers Eyes-Becoming a customer-centered organization
- Success Story #2 Bank One Bigger… Now Better
- Executing Corporate Strategy with Lean Six Sigma
- Success Story #3 Fort Wayne, Indiana From 0 to 60 in nothing flat
- The Value in Conquering Complexity
- Success Story #4 Stanford Hospital and Clinics At the forefront of the quality revolution
Part II - Deploying Lean Six Sigma in Service Organizations
- Phase 1 Readiness Assessment
- Phase 2 Engagement (Creating Pull)
- Phase 3 Mobilization
- Phase 4 Performance and Control
Part III - Improving Services
EAN: 2147483647
Pages: 150
