Section C: The Toolbox and Server Explorer
| I l @ ve RuBoard |
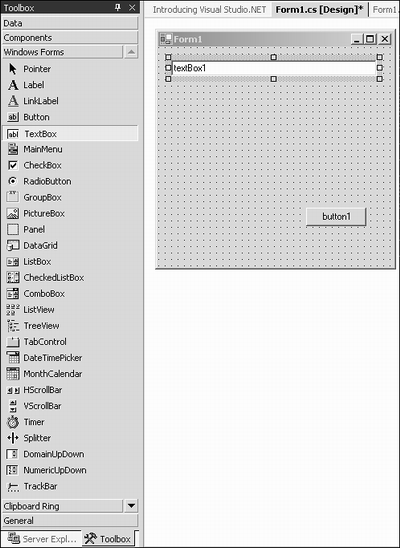
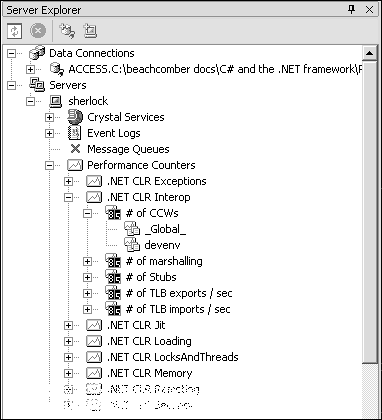
| Floating the mouse over this toolbar will cause it to concertina out so that you can access the individual components . The animated toolbox is a screen real-estate saving device. If you're lucky enough to have a 36-inch monitor, you won't need any of the space saving innovations. Therefore, you can pin all the controls immovably in place with the pushpin icon that you'll see in the top-right corner of the pane. Also, if you have that big monitor and you love to write really long lines of code, you can cause the other panes on the right side, the Solution Explorer and so on, to concertina away by unpinning their pushpins. The ToolboxThe Toolbox is another toolbar that contains multiple sections, the primary one being the component toolbox. Editing Windows Forms layouts, adding items to dialogs, and placing other resources all rely on the toolbox as the drag-source for the palette of available items. The contents of the Toolbox are very dynamic and will change according to the task you are performing. When editing a Windows Form, you'll see the Forms list; when editing a UML diagram, you'll see UML components. Figure 1.5.11 shows the Toolbox in its expanded and pinned state. The interface is similar to that of Microsoft Outlook's Outlook Bar but more compact. Figure 1.5.11. The Toolbox. Here, you can see that a Windows Form is being edited. Components are dragged from the Toolbox and placed on the form. They can be moved, sized , and manipulated, as you would expect. The Server ExplorerThe companion to the Toolbox in this toolbar is the Server Explorer. This is a brand new feature for VS.NET and enables some advanced features that are a real time saver when programming against database servers, message queues, system services, and system event logs. The Server Explorer displays a set of tree nodes for all the servers to which it is connected. You can select various categories of nodes and drag them onto your Windows Form where VS.NET creates a set of adapters for you that allow your program to access the chosen node. Figure 1.5.12 shows the Server Explorer with the performance counter nodes expanded. Figure 1.5.12. The Server Explorer window. Using the Server Explorer, you can drag one of the performance counters onto a Windows Form. For example dragging the _Global_ performance counter from the # of CCWs node onto a form will create a Performance Counter component that you can use to find out how many times marshaling between managed and unmanaged code took place. Similarly, dragging the Access database from the Data Connections node onto a form creates an oleDBConnection to the database. Expanding the database node in the Server Explorer allows you to drag the tables, stored procedures, and views to the form, creating the correct adapters for them as well. You can add a server to the explorer window by using the Tools, Connect to Server menu selection from the main toolbar. After you've connected to the server, you can access its performance counters and system logs, if you have permission. |
| I l @ ve RuBoard |
EAN: 2147483647
Pages: 204

