Monitoring Server Health and Performance
| Good server health is important to a stable and reliable messaging environment. Using a variety of tools included with Windows 2003 and Exchange 2003, administrators can maximize the uptime of the messaging environment by monitoring items such as memory usage, CPU utilization, SMTP queues, or free disk space. Using the Performance ConsoleThe Performance Monitor Console (PerfMon) is a toolbox that provides many ways to monitor and analyze server performance issues, network bottlenecks, or gather baselines of server usage. When using Performance Monitor, be methodical and always check these three Windows server resource objects: memory, processor, and disk. After you have checked that they are not causing the bottleneck, check Exchange-specific countersfor example, MSExchangeIS (Send and Receive queues size) and MSExchangeMTA (MSExchangeMTAWork Queue Length). Some benefits of using PerfMon are understanding what components are doing (for example, is the disk reading or writing most of the time?). Information gathered can be displayed in different formats such as reports and real-time charts or logs, and can help you to know where a minimum investment will produce the maximum gains (such as adding RAM). PerfMon, as shown in Figure 12.2, is launched by selecting Start, All Programs or Programs, Administrative Tools, Performance. Figure 12.2. Viewing server performance in the Performance Monitor Console.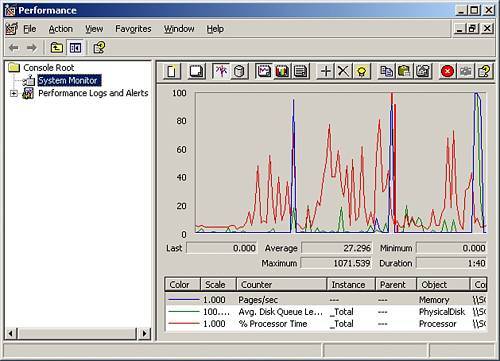 Using Network MonitorThe Network Monitor, as shown in Figure 12.3, is tool that specifically monitors network traffic. Two versions of Network Monitor ship with Microsoft products. The version that comes with Windows Server 2003 is the watered-down version and only allows analysis of traffic sent to or from the server that Network Monitor is running on. The full version of Network Monitor, included with SMS Server, allows monitoring of any machine on your network, determining users' bandwidth consumption and protocol bandwidth consumption, and more. Network Monitor is launched by selecting Start, All Programs or Programs, Administrative Tools, Network Monitor. If prompted, select the network connection to monitor, and then select Capture and click Start. Figure 12.3. Viewing network traffic via Network Monitor.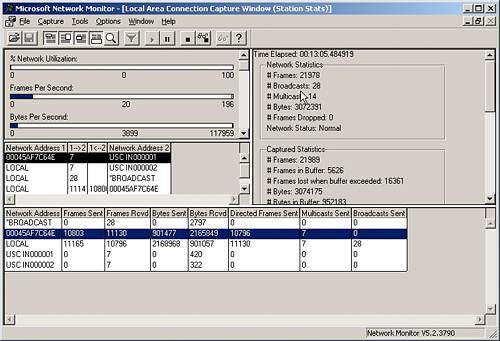 Tip
Using Task ManagerAdministrators can get a quick overall idea of how Exchange 2003 is performing at any given time by launching Task Manager: right-click the taskbar and then click Task Manager. Along the top of the Task Manager window are tabs for Applications, Processes, Performance, Networking, and Users. Each tab provides a brief summary of information. The last two tabs were added because of customer requests for information about networking and user-specific attributes. One caveat with Task Manager is that it cannot save historical datadata that is useful for setting baselines and capacity planning. Monitoring Processor UsageWhen CPU utilization is high, Exchange performance suffers greatly. CPU utilization of 100% can be indicative of serious server problems. If a server is stuck at 100% CPU utilization, rebooting is usually necessary to return the server to a functioning level. To keep a check on CPU utilization, configure CPU monitors using the following steps:
Tip
Monitoring Disk SubsystemsIn Exchange, free disk space is used for tracking messages, logging, data storage, and virtual memory. Running out of hard disk space will cause data loss and Exchange Server errors. Free disk space should be monitored closely. Configure disk monitoring using the following steps:
|
EAN: 2147483647
Pages: 130