Using Graphical Network Status Monitors
| I l @ ve RuBoard |
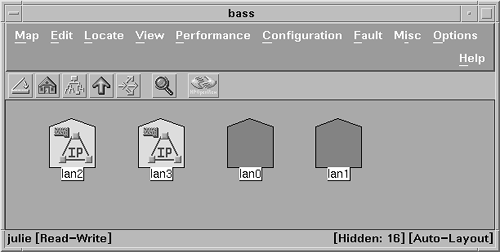
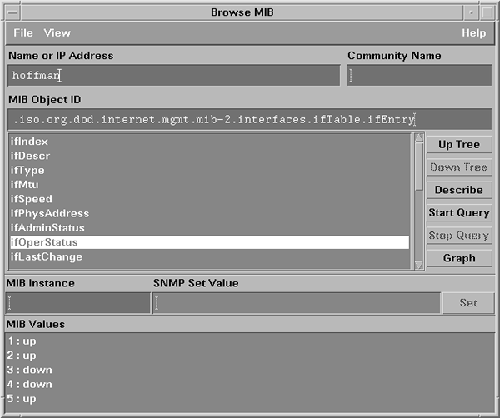
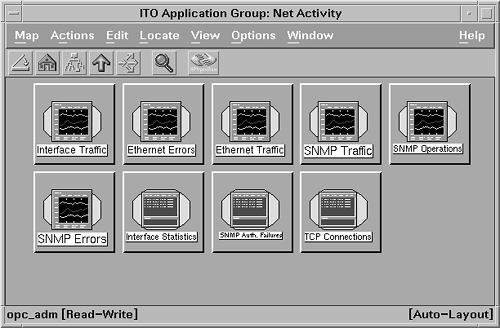
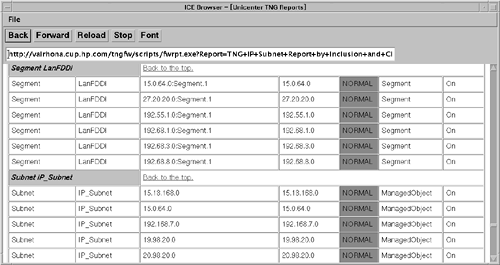
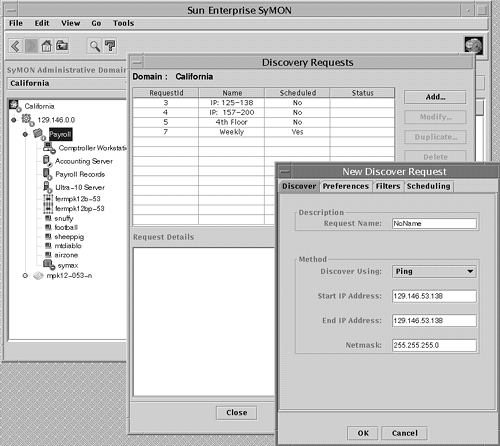
Using Graphical Network Status MonitorsAs mentioned earlier, networking involves numerous different components, such as routers, hubs, bridges, and the system's Network Interface Cards (NICs) and operating system. You will see in this chapter that tools are available to address each of these components individually. Before introducing each of these tools, this section shows how some network management products can reduce the complexity of monitoring your corporate networks. The products discussed in this section, referred to as graphical network status monitors, reduce complexity by providing summary information about the devices at a central location. You don't need to log in remotely to each network device, and you can see status at a glance. Popular network management products include Hewlett-Packard's Network Node Manager, Computer Associates' Unicenter TNG, Sun's Net Manager, IBM's NetView, and HP's NetMetrix. These products offer various unique capabilities, such as the ability to discover automatically all the network devices in your computing environment and display the real-time status of each graphically on network topology maps. A sample of these products is provided in this section. Sun Enterprise SyMON is also discussed in this section, because it is a low-cost alternative to the other products. NetMetrix is discussed later in the chapter, along with other performance tools, because of its primary emphasis on network performance. Network Node ManagerNetwork Node Manager (NNM) is a management product based on the HP OpenView platform. It is used primarily to view and monitor the status of network and system resources. Information is displayed graphically in a windows -based display. A hierarchical set of windows , or submaps, are available to enable users to navigate through the network topologies. From the initial network view, you can drill down to the submap that shows the systems on a specific network segment, as shown in Figure 6-1. Specific statuses of systems are depicted by using different colors for the system icons. The ability to group systems by their network segment can help to isolate a problem to a specific network. As with other network management products, NNM can automatically discover and monitor the status of network-addressable components, such as routers, hubs, and computer systems, via management protocols such as the Simple Network Management Protocol (SNMP). Any IP-addressable device that is accessible from the management system can be displayed. The network topology information is then displayed on submaps, as shown in Figure 6-1. In larger computing environments, you may want to reduce the network overhead of the discovery process by using discovery filters, which enable you to specify the subnetworks that you want to be explored. This can also help to limit the scope of the systems managed from a single management station in your organization. An operator can navigate through the submaps to find a particular LAN segment containing important systems to monitor. In addition to viewing the overall status of a network device, an operator can drill down to see system information, such as configured network interfaces. A system's standby network interfaces ” those without a configured IP address ” can also be shown. The icons can help you distinguish between configured and standby interfaces, as shown in Figure 6-2. Icons without an "IP" symbol are standby interfaces. Figure 6-2. NNM displays a system's network interface status. NNM includes a graphical Event Browser, which displays the events received from systems on the network. Events are sent to the management station as SNMP traps. The trap daemon receives these traps and stores them in a database to maintain an event history. The events can be viewed through the Event Browser, and filters can be used to prevent the operator from being flooded with noncritical information. Filters can be based on several attributes, including the sending system, criticality of the event, or the time. NNM can also process Common Management Information Protocol (CMIP) events for multivendor interoperability. NNM periodically polls network devices to verify that they are working. If no reply is received, a Node Down event is sent as an SNMP trap and logged in NNM Event Browser. This results in a color change of the graphical icon in NNM that represents the device. NNM's reliance on network connectivity to determine status information can create problems if not all networks are globally accessible. If the management station doesn't have a route to a private subnetwork, the subnetwork will appear to be down when examined from the management station. Pull-down menus enable the operator to run tools to get additional real-time information. These tools can be used to check a system's network configuration, including addresses, the routing table, ARP cache entries, and system services. The Fault menu includes tools to test a system's network connectivity, ping the system from the management station, remote ping between two remote systems, and locate the SNMP route to the system. Some of these tools are explained in more detail later in the chapter. Finally, NNM tools are available to collect, set thresholds for, and display the MIB data via SNMP. NNM also provides an xnmgraph utility, which enables the user to input any historical data that was collected and see it in graph form. For additional diagnostic information, you can remotely log in from NNM to the system and execute diagnostic commands. The NNM toolbar provides this feature via telnet, and also provides the capability to launch System Administration Manager (SAM) on the remote system. OpenView's MIB Browser tool also provides diagnostic capability. A Management Information Base (MIB) is a standard way of representing information of a certain category. For example, the MIB-II provides useful information about a system, such as the number of active TCP connections, details about system hardware, and version information. By using the MIB Browser, you can discover which MIBs are available and see the information being provided by each MIB. The MIB Browser tool can check the value of anything contained in a MIB on the remote system. When you find a MIB that contains some useful fields, you can use this tool or other MIB tools to gather that data from the target system. The MIB data is displayed in the MIB Browser's output window on the screen. By browsing through available MIBs and querying values of selected MIB fields, you can gather specific information needed to monitor systems and troubleshoot problems. Figure 6-3 illustrates how you can use the MIB Browser to check the status of the NICs on a given system. Figure 6-3. NNM's MIB Browser. A more detailed description of MIBs, as well as definitions of some of the important MIBs for UNIX servers, are provided in Appendix A. NNM software can run on UNIX and NT management stations and is a building block for other HP OpenView applications. Application integration is provided through developer's kits and registration files. Many applications are integrated today with HP OpenView, with the most commonly used partner applications being CiscoWorks, Bay Networks Optivity, 3Com Transcend, Remedy ARS, and HP NetMetrix. IT/OperationsHewlett-Packard has a product called OpenView IT/Operations (IT/O), a software bundle that not only includes NNM for network management, but also extends its capabilities to provide more in the area of system management. IT/O provides facilities that enable operators to share the management station software, but retain responsibilities for different sets of managed systems. IT/O includes an Application Bank that allows HP products or customer-generated tools to be iconified and available for use by the operator. Operators select the target system, and then select the tool to run on that system. A two-level hierarchy of tools may be defined. Examples of available tools include GlancePlus and PerfView. These tools can then be used to monitor performance on an arbitrary target system from the central management station. The IT/O Application Bank includes three application groups with networking tools: Net Activity, Net Config, and Net Diag. Each of these groups has several tools. The Net Activity group, shown in Figure 6-4, has tools to monitor network activity, including interface traffic, Ethernet errors, Ethernet traffic, SNMP traffic, SNMP operations, SNMP errors, interface statistics, SNMP authorization failures, and TCP connections. The Net Config and Net Diag groups provide many of the same tools provided in NNM pull-down menus mentioned earlier in this section. Figure 6-4. Networking tools available from the IT Application Bank. Unicenter TNGComputer Associates' Unicenter TNG product is comparable to HP's IT/O product. It discovers IP-addressable components and can display them as icons on maps. The maps can reflect the network topology. An Event Browser is also included and can be used to keep a history of SNMP events received from the monitored systems. This Event Browser is shown in Figure 6-5. Figure 6-5. Unicenter TNG Event Browser. Computer system status is reflected on the map with different colors. Like NNM, Unicenter TNG also has difficulty showing the status of private networks correctly. Computer Associates (CA) repackages some of its monitoring and discovery features into its Unicenter TNG Framework, which it ships for free on some platforms, such as HP-UX. Additionally, CA has done some special integration with HP's Event Monitoring Service (EMS) product (discussed later in this chapter), so that the status of monitored resources on the system can be shown graphically. Enterprise SyMONSun Enterprise SyMON is a low-end product for network monitoring. It is able to discover computer systems that are reachable from the management station, and can group systems into "domains" for easier administration. Figure 6-6 shows how this discovery is configured. SyMON provides system status based on the criticality of events received from a system. SyMON can also be used to generate performance graphs. Figure 6-6. Configuring discovery in SyMON. Sun Enterprise SyMON can be used to report network alarms through its graphical display. Events can be generated by configuring rules in the Tool Command Language (TCL) scripting language. SyMON provides an intelligent agent on the managed node that has access to a large set of system data, including the MIB-II. Rules can be configured for the network portion of the MIB-II to send alarms when the interface card's status changes, for example. SyMON also includes diagnostic capabilities. In response to an event, you can drill down to a physical view of the system that includes a photo view of the failed component, based on preloaded GIF files for each system model. The intelligent agent on the managed system can support additional modules being loaded. For example, a module exists that can report events for the NFS. The user can choose which additional modules to load. SyMON is only available for monitoring Sun systems. |
| I l @ ve RuBoard |
EAN: 2147483647
Pages: 90
