6.3 WebSphere Application Server tuning
|
| < Day Day Up > |
|
6.2 Performance monitoring and analysis tools
In this section we introduce the monitoring and tuning tools provided by WebSphere Application Server V5.
This section discusses the following topics:
-
Tivoli Performance Viewer (formerly known as the Resource Analyzer)
-
Performance monitoring servlet
-
PMI Request Metrics
-
Dynamic Cache Monitor
-
Monitoring the IBM HTTP Server
-
Other tools in this area, such as Log Analyzer and Tivoli Performance Advisors
6.2.1 Tivoli Performance Viewer
The Tivoli Performance Viewer (TPV) is a stand-alone runtime performance monitor coming with WebSphere Application Server V5. It provides a GUI console that monitors and analyzes the performance data and is available on Windows and UNIX platforms. It can be used remotely and across platforms. The Tivoli Performance Viewer can record the information it collects and replay it without connecting to WebSphere Application Server.
The tool was formerly known as Resource Analyzer, but was renamed for the WebSphere Application Server V5 release.
Starting Tivoli Performance Viewer
On Windows platforms, to start Tivoli Performance Viewer, do one of the following:
-
Select Start -> Programs -> IBM WebSphere -> Application Server v5.0 ->Tivoli Performance Viewer.
-
Or use the command line:
<WAS_HOME>\bin\tperfviewer.bat host_name port_number connector_type
On UNIX platforms:
Type into a shell:
<WAS_HOME>/bin/tperfviewer.sh host_name port_number connector_type
For example:
tperfviewer.bat localhost 8879 SOAP
Connector_type can be either SOAP or RMI. 8879 is the default ND port for the SOAP connector. 9809 is the default ND port for the RMI connector.
| Note | The default port number varies based on the WebSphere software version in use. That is, the default port for WebSphere Network Deployment is 8879, while the default port for WebSphere Base is 8880. The reason for this is that in a Network Deployment environment, TPV connects to the Deployment Manager host rather than to the individual application server. You can find the default port number by looking for the configured port number using the Administrative Console or in the SystemOut.log file. |
Setting performance monitoring level
The monitoring settings determine which counters are enabled. Changes made to the settings from the Tivoli Performance Viewer affect all applications using the Performance Monitoring Infrastructure (PMI) data.
Steps to set the level:
-
Choose the Data Collection icon on the Resource Selection panel. This selection provides two options on the Counter Selection panel. Choose the Current Activity option to view and change monitoring settings. Alternatively, use File -> Current Activity to view the monitoring settings.
-
Set monitoring levels by choosing one of the following options:
-
None: Provides no data collection
-
Standard: Enables data collection for all modules except enterprise bean method level data
-
Custom: Allows customized settings for each module
These options apply to an entire application server.
-
-
(Optional) Fine tune the monitoring level settings.
-
Click Specify. This sets the monitoring level to custom.
-
Select a monitoring level.
For each resource, choose a monitoring level of None, Low, Medium, High or Maximum. The dial icon will change to represent this level.
Note The instrumentation level is set recursively to all elements below the selected resource. You can override this by setting the levels for children after setting their parents.
-
-
Click OK.
-
Click Apply.
6.2.2 Enabling JVMI facility
The Java Virtual Machine Profiler Interface (JVMPI) is a facility of the JVM used to enable a more comprehensive performance analysis. This profiling tool enables the collection of information, such as garbage collection data, about the Java Virtual Machine (JVM) that runs the application server or Node Agent.
JVMPI is a two-way function call interface between the JVM and an in-process profiler agent. The JVM notifies the profiler agent of various events, such as heap allocations and thread starts. The profiler agent can activate or inactivate specific event notifications, based on the needs of the profiler.
All JVMPI performance data is collected by the JVM module, but JVMPI needs to be enabled for the module to update its counters. To enable Java Virtual Machine Profiler Interface (JVMPI) data reporting for each individual application server or Node Agent:
-
Open the administrative console.
-
Click Servers -> Application Servers or System Administration -> Node Agents in the console navigation tree.
-
Click the application server or node agent for which JVMPI needs to be enabled.
-
Click Process Definition.
-
Click the Java Virtual Machine.
-
Type -XrunpmiJvmpiProfiler in the Generic JVM arguments field.
-
Click Apply or OK.
-
Click Save.
-
Start the application server or node agent, or restart the application server or Node Agent if it is currently running.
6.2.3 Monitoring an application
In this section we discuss what Tivoli Performance Viewer (TPV) can do to monitor enterprise applications running on WebSphere Application Server.
Before starting the TPV, the PMI service has to be enabled for the application servers you would like to monitor. See "Enabling PMI service using the administrative console" on page 178 or "Enabling PMI service through wsadmin" on page 179 for a description of how to enable the PMI service.
Refresh data
When new modules or instances (JSPs, servlets, enterprise beans) are loaded by WebSphere Application Server while Tivoli Performance Viewer is running, they are not automatically displayed and included in performance data reporting.
Use the following steps to include newly loaded modules or instances:
-
Select the resource category that the module or instance belongs to.
-
Select File -> Refresh from the main menu, or click the Refresh icon in the toolbar.
-
Set the instrumentation level for this new module or instance as described in "Setting performance monitoring level" on page 181.
Showing correlated counters
To analyze the performance data captured by Tivoli Performance Viewer, it is often necessary to correlate counters from multiple modules. To select multiple counters in one chart or table:
-
Hold down the Ctrl key and select the resource categories whose counters you want to see.
-
Select the required counters using the Select column in the counter selection window on the lower left.
For example, in Figure 6-4 you can see that the counters for Created Sessions (from Servlet Session Manager), Num Allocates (from JDBC Connection Pools), and Average Response Time (from Web Applications) have all been selected.
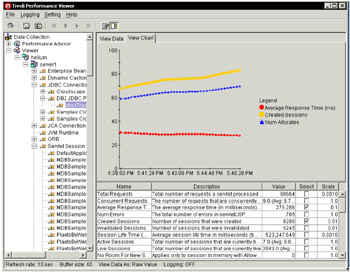
Figure 6-4: Show multiple counts from different resource categories
Record a load scenario
All data being reported by the Tivoli Performance Viewer can be saved in a log file. The data is written to the log as serialized Java objects or as an XML document. To start recording data, do the following:
-
Select Logging -> On... from the Tivoli Performance Viewer main menu or click the Logging on/off icon in the toolbar.
-
In the Save log file window, specify the file name (and path), and select Save as type. The Save as type field allows an extension of *.perf (Tivoli Performance Viewer logs) for binary files or *.xml for XML files.
-
Click OK.
To stop the recording of data, select Logging -> Off from the main menu or click the Logging on/off icon in the toolbar.
Replaying a load scenario
Both log file types can be replayed using the Tivoli Performance Viewer. Log files saved in XML format (*.xml) provide the option of analysis using third-party tools, but can get rather large. If size is of concern, it is recommended that you zip the files while they are not needed. To replay a log file, do the following:
-
Select File -> Log from the Tivoli Performance Viewer main menu.
-
Click the Browse... button to open the file browser.
-
In the Open window, locate the name of the file to replay and click the Open button.
-
Click the Play icon from the toolbar or select Setting -> Log Replay -> Play from the main menu.
By default, the data is replayed at the same rate it is collected (written to the log). If data is collected every minute, it is displayed every minute. You can change the speed at which the log is replayed by clicking the FF button (Fast Forward) in the toolbar or by selecting Setting -> Log Replay -> FF from the main menu.
While replaying the log, you can change your resource selections with the resource selection pane. You can also view the data in either of the views available (data or chart) in the data display window.
You can stop and resume the log at any point. However, data cannot be replayed in reverse.
To rewind the log file, click the Rewind button in the toolbar or select Setting -> Log Replay -> Rewind from the main menu.
Clearing values from tables and charts
After stopping a resource, use the Clear Values operation to remove the remaining data from a table or chart. You can then begin populating the table or chart with new data. To clear the values currently displayed, do the following:
-
Select one or more resources in the resource hierarchy.
-
Select Setting -> Clear Buffer from the main menu. Alternatively, click the Clear Buffer icon in the toolbar.
Resetting counters to zero
To reset the start time for calculating aggregate data, do the following:
-
Select one or more resources in the resource hierarchy.
-
Select Setting -> Reset to Zero from the main menu. Alternatively, click the Reset to Zero icon in the toolbar.
The reset operation sets the clock used for reporting aggregate data for counters of the selected performance category. Instead of reporting data from the time the server was started, reporting now begins from the time of the reset action. Not all counters can be reset. If you use the reset operation for a group containing counters that cannot be reset, the reset action has no effect. You can select multiple performance groups and reset them simultaneously.
Viewing and modifying chart data
When selected counters are using measurement units that are not proportionally similar, the scaling factor can be set manually to allow a more meaningful display. The following sections explain how you can manually change the scaling factor for the chart view.
Scaling the chart display manually
To manually change the scale of a counter:
-
In the counter selection window, on the lower right, double-click the Scale column for the counter that you want to modify.
-
Type the desired scale value for the counter into the field.
The chart view will be updated immediately to reflect the change in the scaling factor.
The possible values for the Scale field range from 0 to 100, and the relationship is shown in Table 6-1.
| Scale value | Comment |
|---|---|
| < 1 | Scaling reduces the value. For example, a scale of 0.5 means that the data points for the variable are reduced to half of their actual values. |
| = 1 | The value is not scaled. This is the default. |
| > 1 | Scaling increases the value. For example, a scale of 1.5 means that the data points for the variable are increased to one and one-half times their actual values. |
Negative results are displayed as zero (0). This value is reflected only in the View Chart window.
Change display settings
This section looks at some of the Tivoli Performance Viewer display settings:
-
Specifying a different refresh rate
-
Changing the data view
-
Changing the buffer size
Specifying a different refresh rate
By default, the Tivoli Performance Viewer retrieves data from the administrative server every 10 seconds. To change the rate at which data is retrieved from the server, do the following:
-
Select Setting -> Set Refresh Rate... from the main menu.
-
In the Set Refresh Rate window, type a positive integer representing the number of seconds. The integer must be 1 or greater.
-
Click OK.
Changing the data view
The data view mode determines whether counter values represent absolute values, changes in values, or rates of change. The data view mode meanings differ slightly depending on where you are viewing data. To change the data view mode:
-
Select Setting -> View Data As from the main menu.
-
Select from the following choices:
-
Raw Value. Displays the absolute values. If the counter represents load data (for example, the average number of connections in a database pool or the average number of live bean objects), the Tivoli Performance Viewer displays the current value followed by the average, for example, 18(avg:5).
-
Change in Value. Displays the change in the current value from a previous value.
-
Rate of Change. Displays the ratio change/(T1 - T2), where change is the change in the current value from a previous value, T1 is the time when the current value was retrieved, and T2 is the time when the previous value was retrieved.
-
Changing the buffer size
By default, the View Data window displays 40 rows, corresponding to the values of the last 40 data points retrieved from the administrative server. To change the size of the table (number of rows displayed):
-
Select Setting -> Set Buffer Size... from the main menu.
-
In the Set Buffer Size window, specify the number of rows to display.
-
Click OK.
6.2.4 PMI request metrics
PMI request metrics is a facility introduced in WebSphere Application Server V5 for providing response-time information for the major services used by a request as it moves through application servers. A PMI request metrics record is created while a response to a request is being generated. It contains information about the request, such as its type, URI, invoked bean method, client origin, etc., and the time spent responding by major WebSphere services. Metrics are produced at the Web and EJB container level and are measured from the time the request enters the container to the time a response is provided.
The request metrics component is designed to be very lightweight in processing and to have the smallest resource footprint possible. This is very important because the facility is globally enabled and extends to every Web and EJB container in the cell. To minimize process and resource usage, a filter can be applied to the metrics component in order to allow only a subset of incoming requests to be monitored. This filter mechanism not only reduces process usage but also minimizes the amount of metrics data produced.
The request metrics record can be written to a text file (System.out) or sent to an Application Response Measurement (ARM 2.0) compliant agent, or both. Every Web container and EJB container stores the time stamp of all requests entering that specific container and writes a record with response time and other metrics to the System.out JVM log or to an available ARM agent as soon as a response is provided. As requests in a WebSphere environment often fan out to different processes on several physical nodes, request metrics can be scattered across different log files. The metrics can be correlated together to resemble a detailed sequence diagram of request response times.
Request metrics are useful for getting information on overall system performance, and hence give WebSphere administrators and developers a feel for the experience a user might have with the system at a given time. They can also be used to give an indication of what component is causing problems to the overall system performance and needs to be examined more closely; problems being application flaws, bottlenecks, leaks, communications, etc. The indication of problems with a specific component can also be helpful in tuning efforts in order to direct the attention to the correct node and process.
Enabling and configuring PMI request metrics
Request metrics are enabled and configured globally for all application servers in the cell. For a single-server environment, the metrics are enabled and configured for all application servers residing on the local node.
The PMI request metrics component can be enabled, disabled, and configured at runtime, without having to restart each individual application server in the cell.
To enable the PMI request metrics using the Administrative Console select Troubleshooting -> PMI Request Metrics. From here you can do the following:
-
Enable/disable the request metrics.
-
Enable an ARM agent. This implies that you have installed an ARM agent that supports request metrics.
-
Specify the level of detail on the request metrics data, as shown in Figure 6-5. A setting of NONE produces no metrics data. HOPS shows the EJB method invoked, requested URI, or JDBC statement executed, along with the response time. PERF_DEBUG and DEBUG give you more detailed information but are more performance intensive.
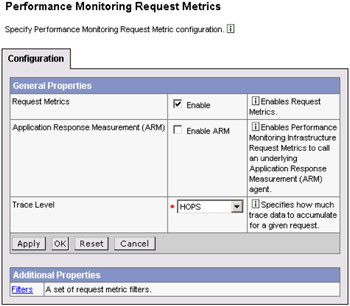
Figure 6-5: PMI request metrics configuration panel
As soon as request metrics are enabled and a trace level greater than NONE is specified and saved to the WebSphere configuration, trace records are written to the System.out JVM log for all application servers for any incoming Web or EJB request.
PMI request metrics trace record format
The request metric trace record written to the System.out JVM log has the following format:
PMRM0003I: parent:ver=n,ip=n.n.n.n,time=nnnnnnnnnn,pid=nnnn,reqid=nnnnnn,event=nnnn - current:ver=n,ip=n.n.n.n,time=nnnnnnnnnn,pid=nnnn,reqid=nnnnnn,event=nnnn type=TTT detail=some_detail_information elapsed=nnnn
The fields of the trace record are described in Table 6-2. Note that PMRM0003I is the message identifier for trace records as found in the System.out log. Table 6-3 lists the entries of the correlator fields (identical for both parent and current correlator).
| Field | Description |
|---|---|
| parent | Identifier to uniquely represent the upstream request (parent correlator). |
| current | Identifier to uniquely represent the current request (current correlator). |
| type | Type of request (valid types: URI, EJB or JDBC). |
| detail | Detailed request information showing the full URI of the request, the fully qualified EJB method invoked, or the JDBC SQL statement executed. |
| elapsed | The total elapsed time for the operation in milliseconds. The time includes time for all child operations performed (metrics records having their parent correlator field equal to this record's current correlator). |
| Field | Description |
|---|---|
| ver | The version of the correlator. For convenience, it is duplicated in both the parent and current correlators. |
| ip | The IP address of the node of the application server that generated the correlator. |
| pid | The process ID of the application server that generated the correlator. |
| time | The start time of the application server process that generated the correlator. |
| reqid | An ID assigned to the request by Request Metrics, unique to the application server process. |
| event | An event ID assigned to differentiate the actual trace events. |
The type and detail fields are described as follows:
-
Universal Resource Identifier (URI): The trace record was generated by a Web component. The URI is the name of the URI used to invoke the request.
-
Enterprise bean (EJB): The fully qualified package and method name of the enterprise bean.
-
Java Database Connectivity (JDBC): The values select, update, insert, or delete for prepared statements. For non-prepared statements, the full statement can appear.
The trace record format is composed of two correlators: A parent correlator and current correlator. The parent correlator represents the upstream request and the current correlator represents the current operation. If the parent and current correlators are the same, then the record represents an operation that occurred as it entered WebSphere Application Server.
To correlate trace records for a particular request, collect records with a message ID of PMRM0003I from the appropriate server logs. Records are correlated by matching current correlators to parent correlators. The logical tree can be created by connecting the current correlators of parent trace records to the parent correlators of child records. This tree shows the progression of the request across the server cluster.
6.2.5 Log Analyzer
The Log Analyzer is a GUI tool that allows the user to view any logs generated with log analyzer trace format, such as the IBM service log file and other traces using this format. It can take one or more service logs or trace logs, merge all the data, and display the entries in sequence. Log Analyzer is shipped with an XML database, the symptom database, which contains entries for common problems, reasons for the errors, and recovery steps. The Log Analyzer compares every error record in the log file to the internal set of known problems in the symptom database and displays all the matches. This allows the user to get error message explanations and information such as why the error occurred and how to recover from it.
6.2.6 Other monitoring facilities
In this section we have a brief introduction of other monitoring facilities in WebSphere Application Server V5 that are not discussed in previous sections, such as Dynamic Cache Monitor. For more information please refer to the WebSphere InfoCenter and the HTTP Server InfoCenter.
Dynamic Cache Monitor
J2EE applications have high read/write ratios and can tolerate small degrees of latency in the currency of their data. Therefore the dynamic cache creates an opportunity for significant gains in server response time, throughput, and scalability. You can use the dynamic cache to improve the performance of servlet and JSP files by serving requests from an in-memory cache. Cache entries contain servlet output, results of servlet execution, and metadata.
WebSphere Application Server consolidates several caching activities, including servlets, Web services, and WebSphere commands into one service called the dynamic cache. These caching activities work together to improve application performance, and share many configuration parameters, which are set in an application server's dynamic cache service.
The Dynamic Cache Monitor is an installable Web application that displays simple cache statistics, cache entries, and cache policy information. Install the application CacheMonitor.ear from the install_root/installableApplications directory. Access the Web application using a Web browser and the URL http://<your hostname>:<your port_number>/cachemonitor, where <your port_number> is the administrative port or the default port based on whether you installed the application on the admin host or the default host.
Monitoring IBM HTTP Server
The Windows version of IBM HTTP Server includes Windows performance monitor hooks. This allows you to use the Windows NT® performance monitor or the Windows 2000 system monitor to observe the current state of an active IBM HTTP Server, along with all kinds of other system resources.
For more information, please refer to the IBM HTTP Server InfoCenter:
-
http://www.ibm.com/software/webservers/httpservers/library.html
6.2.7 Developing your own monitoring applications
You can use the Performance Monitoring Infrastructure (PMI) interfaces to develop your own applications to collect and display performance information.
There are three such interfaces: A Java Machine Extension (JMX)-based interface, a PMI client interface, and a servlet interface. All three interfaces return the same underlying data. The JMX interface is accessible through the AdminClient API. The PMI client interface is a Java interface that works with Version 3.5.5 and later. The servlet interface is perhaps the simplest, requiring minimal programming, as the output is XML.
For more information on developing you own monitoring applications, refer to WebSphere InfoCenter.
|
| < Day Day Up > |
|
EAN: N/A
Pages: 90
- Challenging the Unpredictable: Changeable Order Management Systems
- ERP System Acquisition: A Process Model and Results From an Austrian Survey
- Enterprise Application Integration: New Solutions for a Solved Problem or a Challenging Research Field?
- Intrinsic and Contextual Data Quality: The Effect of Media and Personal Involvement
- Development of Interactive Web Sites to Enhance Police/Community Relations