Chapter 7: Monitoring and Tuning of DB2 UDB V8
|
| < Day Day Up > |
|
6.3 WebSphere Application Server tuning
The performance of a WebSphere Application Server system depends on various factors, including network, database, memory, application design, and application server configuration. Since these factors vary from installation to installation, each recommendation should be evaluated for applicability in one's own unique situation.
6.3.1 WebSphere Queuing Network
In a typical J2EE application, a client request flows through a Web server, application server, and a database. With WebSphere Application Server, the request flows through a network of queues [1].
These queues represent WebSphere Application Server system resources and should be tuned to achieve optimal performance. These queues include the network, Web server, Web container, EJB container, Object Request Broke(ORB), datasource, and possibly a connection manager to a custom backend system, as shown in Figure 6-6.
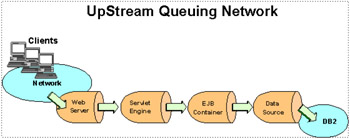
Figure 6-6: WebSphere queuing network
Each of these WebSphere Application Server resources represents a queue of requests waiting to use that resource. WebSphere Application Server queues are load-dependent resources, and therefore the average service time of a request depends on the number of concurrent clients.
Queues may either be closed or open:
-
A closed queue allows the administrator to limit the maximum number of requests active in that queue.
A closed queue allows system resources to be tightly managed. For example, the Web container's Max Connections setting controls the size of the Web container thread pool. If the average servlet running in the Web container creates 10 MB of objects during each request, then setting Max Connections to 100 would limit the memory consumed by the Web container to approximately 1 GB. Hence, closed queues typically allow the system administrators to manage their applications more effectively and robustly.
In a closed queue, a request can be in one of the two following states:
-
Active: In this state, a request is doing work, or is waiting for a response from a downstream queue. For example, an active request in the Web server is either doing work such as retrieving static HTML, or waiting for a request to complete in the Web container.
-
Waiting: In this state, the request is waiting to become active. The request will remain in the waiting state until one of the active requests finishes processing and vacates the queue.
-
-
An open queue does not allow the administrator to restrict the maximum number of requests active in that queue.
6.3.2 Configuring WebSphere Application Server queues
We now outline a methodology for configuring the WebSphere Application Server queues.
There are four general rules for tuning the queues.
-
Minimize the number of requests in WebSphere Application Server queues.
In general, you should make requests wait in the network in front of the Web server, rather than waiting in the WebSphere Application Server. This configuration only supports those requests that are ready for processing to enter the queuing network. Specify that the queues furthest upstream or closest to the client are slightly larger, and queues further downstream or furthest from the client are progressively smaller. Figure 6-7 on page 195 shows an example.
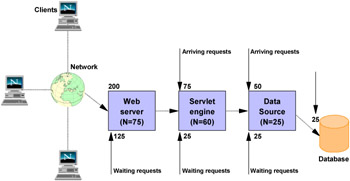
Figure 6-7: WebSphere request queuingQueues in the queuing network become progressively smaller as work flows downstream. When 200 client requests arrive at the Web server, 125 requests remain queued in the network because the Web server is set to handle 75 concurrent clients. As the 75 requests pass from the Web server to the Web container, 25 requests remain queued in the Web server and the remaining 50 are handled by the Web container. This process progresses through the data source until 25 user requests arrive at the final destination, the database server. Because there is work waiting to enter a component at each point upstream, no component in this system must wait for work to arrive. The bulk of the requests wait in the network, outside of the WebSphere Application Server. This type of configuration adds stability, because no component is overloaded. You can then use the Edge Server to direct waiting users to other servers in a WebSphere Application Server cluster.
-
Draw throughput curves to determine when the system capabilities are maximized.
You can use a test case that represents the full spirit of the production application by either exercising all meaningful code paths or using the production application. Run a set of experiments to determine when the system capabilities are fully stressed or when it has reached the saturation point. Conduct these tests after most of the bottlenecks are removed from the application. The goal of these tests is to drive CPUs to near 100 percent utilization. For maximum concurrency through the system, start the initial baseline experiment with large queues. For example, start the first experiment with a queue size of 100 at each of the servers in the queuing network: Web server, Web container, and data source. Begin a series of experiments to plot a throughput curve, increasing the concurrent user load after each experiment. For example, perform experiments with one user, two users, five, 10, 25, 50, 100, 150 and 200 users. After each run, record the throughput requests per second, and response times in seconds per request. The curve resulting from the baseline experiments resembles the typical throughput curve shown in Figure 6-8.
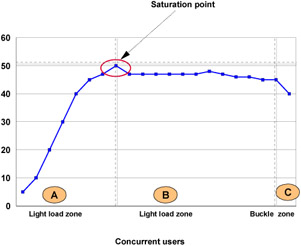
Figure 6-8: Throughput curveThe WebSphere Application Server throughput is a function of the number of concurrent requests present in the total system. Section A, the light load zone, shows that as the number of concurrent user requests increases, the throughput increases almost linearly with the number of requests. At light loads, concurrent requests face very little congestion within the WebSphere Application Server system queues. At some point, congestion starts to develop and throughput increases at a much lower rate until it reaches a saturation point that represents the maximum throughput value, as determined by some bottleneck in the WebSphere Application Server system. The most manageable type of bottleneck occurs when the WebSphere Application Server machine CPUs become fully utilized because adding CPUs or more powerful CPUs fixes the bottleneck.
In the heavy load zone or Section B, as the concurrent client load increases, throughput remains relatively constant. However, the response time increases proportionally to the user load. That is, if the user load is doubled in the heavy load zone, the response time doubles. At some point, represented by Section C, the buckle zone, one of the system components becomes exhausted. At this point throughput starts to degrade. For example, the system might enter the buckle zone when the network connections at the Web server exhaust the limits of the network adapter or if the requests exceed operating system limits for file handles.
If the saturation point is reached by driving CPU utilization close to 100 percent, you can move on to the next step. If the saturation CPU occurs before system utilization reaches 100 percent, it is likely that another bottleneck is being aggravated by the application. For example, the application might be creating Java objects causing excessive garbage collection bottlenecks in the Java code.
There are two ways to manage application bottlenecks: Remove the bottleneck or clone the bottleneck. The best way to manage a bottleneck is to remove it. You can use a Java-based application profiler, such as WebSphere Studio Application Developer, Performance Trace Data Visualizer (PTDV), Borland's Optimizeit, JProbe, or Jinsight to examine overall object utilization.
-
Decrease queue sizes while moving downstream from the client.
The number of concurrent users at the throughput saturation point represents the maximum concurrency of the application. For example, if the application saturates WebSphere Application Server at 50 users, using 48 users might produce the best combination of throughput and response time. This value is called the Max Application Concurrency value. Max Application Concurrency becomes the preferred value for adjusting the WebSphere Application Server system queues. Remember, it is desirable for most users to wait in the network; therefore, queue sizes should increase when moving downstream farther from the client. For example, given a Max Application Concurrency value of 48, start with system queues at the following values: Web server 75, Web container 50, data source 45. Perform a set of additional experiments adjusting these values slightly higher and lower to find the best settings.
To help determine the number of concurrent users, view the Servlet Engine Thread Pool and Concurrently Active Threads metric in the Tivoli Performance Viewer.
-
Adjust queue settings to correspond to access patterns.
In many cases, only a fraction of the requests passing through one queue enter the next queue downstream. In a site with many static pages, a number of requests are fulfilled at the Web server and are not passed to the Web container. In this circumstance, the Web server queue can be significantly larger than the Web container queue. In the previous example, the Web server queue was set to 75, rather than closer to the value of Max Application Concurrency. You can make similar adjustments when different components have different execution times.
For example, in an application that spends 90 percent of its time in a complex servlet and only 10 percent of its time making a short Java database connectivity (JDBC) query, on average 10 percent of the servlets are using database connections at any time, so the database connection queue can be significantly smaller than the Web container queue. Conversely, if the majority of servlet execution time is spent making a complex query to a database, consider increasing the queue values at both the Web container and the data source. Always monitor the CPU and memory utilization for both the WebSphere Application Server and the database servers to verify that the CPU or memory are not saturating.
Let us now look at how to configure the queue network in each layer.
Web Server
All Web servers supported by WebSphere Application Server maintain a thread pool to process the incoming HTTP request. Their size can be controlled by the following parameters in conf/httpd.conf:
-
IBM HTTP Server
-
MaxClients for UNIX
-
ThreadsPerChild for Windows
-
-
Microsoft IIS
-
MaxPoolThreads
-
PoolThreadLimit
-
There is a way to monitor how many clients/threads are being used under load. Use IBM HTTP Server server-status. (This choice works on all platforms.) To enable the server-status module, do the following:
-
Edit httpd.conf located in the directory <IBM HTTP Server Home>/conf and remove the comment character "#" from the lines shown in Example 6-2.
Example 6-2: Enabling HTTP Server server-status in httpd.conf on Windows

#LoadModule status_module modules/ApacheModuleStatus.dll #<Location/server-status> #SetHandler server-status #</Location>
-
Save the changes and restart the IBM HTTP server.
-
In a Web browser, go to the URL http://yourhost/server-status and click Reload to update the status.
-
Alternatively, if the browser supports refresh, go to http://yourhost/server-status?refresh=5 to refresh every five seconds.
On Windows, there is another way to find out how many threads are being used under load. Use the Windows NT or 2000 Performance Monitor. To open the Performance Monitor, select Start -> Programs -> Administrative Tools -> Performance Monitor. In Performance Monitor, select Edit -> Add to chart. Then set the following:
-
Object: IBM HTTP Server
-
Instance: Apache
-
Counter: Waiting for connection
To calculate the number of busy threads, subtract the Number Waiting (Windows NT or 2000 Performance Monitor) from the Total Available (ThreadsPerChild).
Web container
To route servlet requests from the Web server to the Web containers, a transport queue between the Web server plug-in and each Web container is established. The number of client requests accepted by the container is determined by the Web container thread pool. Connection reuse is another factor that influences the number of concurrent threads that are processed by the Web container.
Thread pool size
The Web container has a pool of threads to process inbound servlet/JSP requests and Web services and can be set in the WebSphere Application Server V5 Admin Console, as shown in Figure 6-9 on page 200.
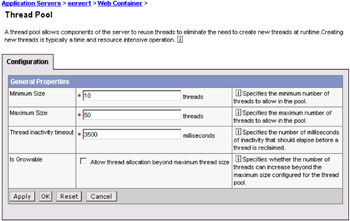
Figure 6-9: Web container queue settings
Tivoli Performance Viewer can help tune the Web container thread pool size settings. Use a standard workload that represents a typical number of incoming client requests, use a fixed number of iterations, and use a standard set of configuration settings. Watch the Percent Maxed and Active Threads counters of the Web container submodule of the Thread Pools module. If the value of the Percent Maxed counter is consistently in the double digits, then the Web container could be a bottleneck and the number of threads should be increased.
On the other hand, if the number of active threads is significantly lower than the number of threads in the pool, consider lowering the thread pool size for a performance gain.
| Note | For Linux systems, 25 is recommended for the maximum thread pool size. |
| Note | Checking the Growable Thread Pool box on the Thread Pool Configuration page allows for an automatic increase of the number of threads beyond the maximum size configured for the thread pool. As a result of this, the system can become overloaded because too many threads are allocated. |
MaxKeepAliveConnections
The MaxKeepAliveConnections parameter specifies the maximum number of concurrent connections to the Web container that are allowed to be kept alive, that is, to be processed in multiple requests. To make a particular transport close connections after a request, you can set MaxKeepAliveConnections to 0 (zero) or you can set KeepAliveEnabled to false on that transport.
The Web server plug-in keeps connections open to the application server as long as it can. However, if the value of this property is too small, performance is negatively impacted because the plug-in has to open a new connection for each request instead of sending multiple requests through one connection. The application server might not accept a new connection under a heavy load if there are too many sockets in TIME_WAIT state. If all client requests are going through the Web server plug-in and there are many TIME_WAIT state sockets for port 9080, the application server is closing connections prematurely, which decreases performance. The application server closes the connection from the plug-in, or from any client, for any of the following reasons:
-
The client request was an HTTP 1.0 request when the Web server plug-in always sends HTTP 1.1 requests.
-
The maximum number of concurrent keep-alives was reached. A keep-alive must be obtained only once for the life of a connection, that is, after the first request is completed, but before the second request can be read.
-
The maximum number of requests for a connection was reached, preventing denial of service attacks in which a client tries to hold onto a keep-alive connection forever.
-
A time out occurred while waiting to read the next request or to read the remainder of the current request.
The value should be at least 90 percent of the maximum number of threads in the Web container thread pool. If it is 100 percent of the maximum number of threads in the Web container thread pool, all the threads could be consumed by keep-alive connections, leaving no threads available to process new connections.
The netstat command utility can help tune the maximum keep-alive connections setting. Use a standard workload that represents a typical number of incoming client requests, use a fixed number of iterations, and use a standard set of configuration settings. Watch the number of connections in the TIME_WAIT state to the application server port. If the count of TIME_WAITs is consistently in the double digits, it might improve performance to raise the maximum keep-alive connections or maximum keep-alive requests parameters. Commands for retrieving the count of TIME_WAITs are shown in Example 6-3. Substitute the port number with the port of the specific application server you want to monitor. Be aware that having both the Web server and application server installed on the same machine would result in a double count of every connection since the TIME_WAIT state is listed from both the client side and server side by netstat.
Example 6-3: Using netstat to determine the time_wait values
On the Windows platform the chain of commands would be: netstat -na | find /i "time_wait" | find /c "9080" On the Unix platform the chain of commands would look like: netstat -na | grep -i time_wait | grep -c 9080
MaxKeepAliveRequests
The MaxKeepAliveRequests is the maximum number of requests allowed on a single keep-alive connection. This parameter can help prevent denial of service attacks when a client tries to hold onto a keep-alive connection. The Web server plug-in keeps connections open to the application server as long as it can, providing optimum performance.
A good starting value for the maximum number of requests allowed is 100. If the application server requests are received from the Web server plug-in only, increase this parameter's value. The netstat utility can be used to tune the value of maximum keep-alive requests as described in "MaxKeepAliveConnections" on page 200. If the number of connections in the TIME_WAIT state is too high, consider raising the maximum keep-alive requests setting.
EJB container
In EJB container, the following parameters can be adjusted to improve the performance.
ORB thread pool size
Method invocations to enterprise beans are only queued for requests coming from remote clients going through the RMI activity service. An example of such a client is an EJB client running in a separate Java Virtual Machine (another address space) from the enterprise bean. In contrast, no queuing occurs if the EJB client (either a servlet or another enterprise bean) is installed in the same JVM that the EJB method runs on and the same thread of execution as the EJB client.
Remote enterprise beans communicate by using the RMI/IIOP protocol. Method invocations initiated over RMI/IIOP are processed by a server-side ORB. The thread pool acts as a queue for incoming requests. However, if a remote method request is issued and there are no more available threads in the thread pool, a new thread is created. After the method request completes, the thread is destroyed. Therefore, when the ORB is used to process remote method requests, the EJB container is an open queue, due to the use of unbounded threads.
Tivoli Performance Viewer can help tune the ORB thread pool size settings. Use a standard workload that represents a typical number of incoming client requests, use a fixed number of iterations, and use a standard set of configuration settings. Watch the Percent Maxed counter of the Object Request Broker submodule of the Thread Pools module. If the value of this counter is consistently in the double digits, then the ORB could be a bottleneck and the number of threads in the pool should be increased. The degree to which the ORB thread pool value needs to be increased is a function of the number of simultaneous servlets (that is, clients) calling enterprise beans and the duration of each method call. If the method calls are longer or the applications spend a lot of time in the ORB, consider making the ORB thread pool size equal to the Web container size. If the servlet makes only short-lived or quick calls to the ORB, servlets can potentially reuse the same ORB thread. In this case, the ORB thread pool can be small, perhaps even one-half of the thread pool size setting of the Web container.
The ORB Thread pool size can be configured using the WebSphere Admin Console, as shown in Figure 6-10. As explained above, this pool can grow beyond the specified size depending on the incoming traffic.
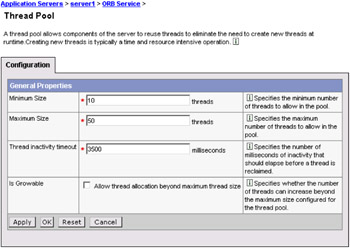
Figure 6-10: ORB thread pool size
Cache settings (cache size and cleanup interval)
To determine the cache absolute limit, multiply the number of enterprise beans active in any given transaction by the total number of concurrent transactions expected. Then add the number of active session bean instances. Use the Tivoli Performance Viewer to view bean performance information. The cache settings consist of two parameters: The cache size and the cleanup interval (see Figure 6-11 on page 204).
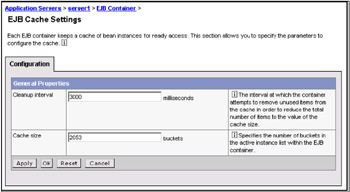
Figure 6-11: EJB cache settings
The cleanup interval specifies the interval at which the container attempts to remove unused items from the cache in order to reduce the total number of items to the value of the cache size.
The cache size specifies the number of buckets in the active instance list within the EJB container.
Data sources
During WebSphere Application Server startup, the database connection pool is created with a zero size, and it grows until it reaches the maximum size, depending on the demand.
Tivoli Performance Viewer provides detailed performance data about each data source pool, as shown in Figure 6-12 on page 205.
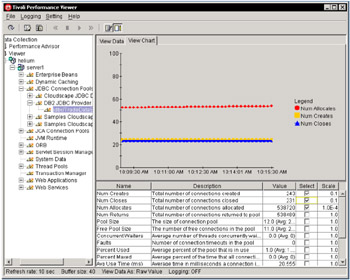
Figure 6-12: TPV datasource monitoring
The data includes the number of connections allocated, returned, and the average wait time before a connection is granted. The summary report for the database connection pool provides information about the pool in use and the pool size over time.
Database connection pool size and prepared statement cache tuning is covered in detail in "Connection pooling" on page 288 and "Prepared statement cache" on page 292.
6.3.3 Using Performance Advisors
WebSphere Application Server V5 provides the following Performance Advisors:
-
Runtime Performance Advisor
-
Performance Advisor in Tivoli Performance Viewer
Runtime Performance Advisor
The Runtime Performance Advisor provides advice to help tune systems for optimal performance and is configured using the WebSphere Application Server administrative console. The Runtime Performance Advisor uses Performance Monitoring Infrastructure (PMI) data to provide recommendations for performance tuning. Running in the JVM of the application server, this advisor periodically checks for inefficient settings, and issues recommendations as standard product warning messages. These recommendations are displayed both as warnings in the administrative console under WebSphere Runtime Messages in the WebSphere Status panel and as text in the application server SystemOut.log file. Enabling the Runtime Performance Advisor has minimal system performance impact.
The following are the instructions on how to use the Runtime Performance Advisor:
-
Enable PMI services in WebSphere Application Server through the administrative console, and enable PMI services in NodeAgent through the administrative console if running WebSphere Application Server Network Deployment.
In order to obtain advice, you must first enable the performance monitoring service through the administrative console and restart the server. If running Network Deployment, you must enable PMI service on both the server and on the node agent and restart the server and node agent. The Runtime Performance Advisor enables the appropriate monitoring counter levels for all enabled advice. If there are specific counters that are not wanted, disable the corresponding advice in the Runtime Performance Advisor Panel, and disable unwanted counters.
-
Enable PMI services in NodeAgent through the administrative console. In order to obtain advice, you must enable PMI service on both the server and on the node agent, and restart the server and node agent.
-
Start the administrative console.
-
Click Servers -> Application Servers in the console navigation tree.
-
Click server_name -> Runtime Performance Advisor Configuration.
-
Click the Configuration tab.
-
Select the Number of Processors.
-
Select the appropriate settings for your system configuration to ensure accurate advice.
-
(Optional) Select the interval.
PMI data is taken over an interval of time and averaged to provide advice. The interval specifies the length of the time over which data is taken for this advice. Therefore, details within the advice messages appear as averages over this interval.
-
(Optional) Select the Maximum Warning Sequence.
The Maximum Warning Sequence refers to the number of consecutive warnings issued before the threshold is updated. For example, if the maximum warning sequence is set to 3, then the advisor only sends three warnings to indicate that the prepared statement cache is overflowing. After that, a new alert is only issued if the rate of discards exceeds the new threshold setting.
-
Click Apply.
-
Click Save.
-
Click the Runtime tab.
-
Click Restart.
Selecting Restart on the Runtime tab reinitializes the Runtime Performance Advisor using the last configuration information saved to disk.
Note This action also resets the state of the Runtime Performance Advisor. For example, the current warning count is reset to zero for each message.
-
Simulate a production level load.
If you are using the Runtime Performance Advisor in a test environment, or doing any other tuning for performance, simulate a realistic production load for your application. The application should run this load without errors. This simulation includes numbers of concurrent users typical of peak periods, and drives system resources, such as CPU and memory to the levels expected in production. The Runtime Performance Advisor only provides advice when CPU utilization exceeds a sufficiently high level.
-
Select the check box to enable the Runtime Performance Advisor to achieve the best results for performance tuning, when a stable production level load is being applied.
Note Enable the Runtime Performance Advisor once conditions have reached a fully loaded condition to achieve the best results for performance tuning.
-
Click OK.
-
Select Warnings in the administrative console under the WebSphere Runtime Messages in the WebSphere Status panel or look in the SystemOut.log file, located in the install_root\logs\servername directory to view tuning advice. Some messages are not issued immediately.
-
Update the product configuration for improved performance, based on advice.
Although the performance advisors attempt to distinguish between loaded and idle conditions, misleading advice might be issued if the advisor is enabled while the system is ramping up or down. This result is especially likely when running short tests. Although the advice helps in most configurations, there might be situations where the advice hinders performance. Due to these conditions, advice is not guaranteed. Therefore, test the environment with the updated configuration to ensure it functions and performs well.
Runtime Performance Advisor output
After completing the appropriate steps, the Advisor will report recommendations into the SystemOut.log. Example 6-4 shows sample output from the Advisor.
Example 6-4: Sample output from the Runtime Advisor
[11/12/03 15:28:53:312 EST] 1b7c0fb7 TraceResponse W TUNE0204W: Performance may be improved by decreasing the number of threads in the ORB thread pool. Try setting the minimum size to 0 and the maximum to 3. The specific data that triggered this message follows. 0% of the pool is in use. CPU usage: 100%. Number of threads in pool: 0. Number of active threads in the pool: 0. The advisor will now look for the pool usage % between 0 and 99. Originally, the advisor looked for the pool usage % between 50 and 99. The acceptable variance is : 81 [11/12/03 15:28:53:312 EST] 1b7c0fb7 TraceResponse W TUNE0208W: Datasource DefaultDatasource does not seem to be in use. If this is true, please delete the data source. If not, set minConnections to 0, and maxConnections to 3. The specific data that triggered this message follows. 0% of the pool is in use. This alert has been issued 1 times in a row. The threshold will be updated to reduce the overhead of the analysis. The advisor will now look for pool size to be greater than 30 with a pool usage of 0%.
TPV Performance Advisor
The Performance Advisor in Tivoli Performance Viewer (TPV) provides advice to help tune systems for optimal performance and gives recommendations on inefficient settings by using collected Performance Monitoring Infrastructure (PMI) data. Advice is obtained by selecting the Performance Advisor icon in TPV. The Performance Advisor in TPV provides more extensive advice than the Runtime Performance Advisor. For example, TPV provides advice on setting the dynamic cache size, setting the JVM heap size, and using the DB2 Performance Configuration Wizard.
If the WebSphere environment is an IBM WebSphere Application Server Network Deployment V5, the only advisor that executes is the TPV Advisor. To utilize the TPV Advisor, direct console access or a remote access tool for UNIX or Windows is required.
The instructions to use TPV Performance Advisor are similar to the instructions to use TPV in "Starting Tivoli Performance Viewer" on page 181 and "Setting performance monitoring level" on page 181.
To review the advisor suggestions, expand the Performance Advisor tree, expand the node that is executing the application server, and highlight the desired application server. Tivoli Performance Viewer polls and retrieves performance data. The TPV Advisor works in conjunction with Tivoli Performance Viewer using the TPV infrastructure. TPV Advisor provides advice based on analysis of the gathered data. If the node being monitored is a production node, it is likely the Advisor will have information available fairly quickly.
Information from the Advisor is categorized into three classifications:
-
Warning
Warning information is provided to indicate possible areas that the Advisor cannot adequately monitor, or other general configuration problems that may need attention.
-
Config
Configuration options that could be changed to improve performance that are read from the base XML configurations and not directly related to captured performance data are listed in this category.
-
Alert
Alert information describes tuning suggestions discovered while monitoring the current load. Alerts make suggestions for changes to existing values as determined by the load currently on the application server.
As the TPV Advisor executes, output is displayed in the Tivoli Performance Viewer application window. Figure 6-13 on page 210 shows a sample of this output. To see the details of a specific advisor message, double-click the message and a new pop-up window will display the exact details of the message.
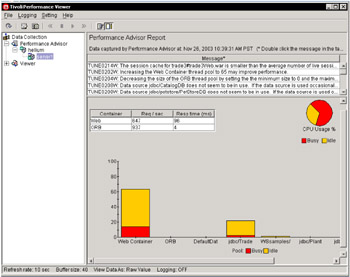
Figure 6-13: TPV Advisor output
The box will also describe how to change the parameter, and where it can be located in the Administrative Console.
6.3.4 JVM memory tuning
This section focuses on tuning JVM memory. Enterprise applications written in Java involve complex object relationships and utilize large numbers of objects. Although Java automatically manages memory associated with an object's life cycle, understanding the application's usage patterns for objects is important. In particular, ensure the following:
-
The application is not over-utilizing objects.
-
The application is not leaking objects (that is, memory).
-
The Java heap parameters are set to handle the use of objects.
Understanding the effect of garbage collection is necessary to apply these management techniques.
The garbage collection
Examining Java garbage collection (GC) can give insight into how the application is utilizing memory. Garbage collection is a Java strength. By taking the burden of memory management away from the application writer, Java applications are more robust than applications written in languages that do not provide garbage collection capability. This robustness applies as long as the application is not abusing objects.
Examining GC gives insights into how the application is utilizing memory. Garbage collection normally consumes anywhere from 5 to 20 percent of the total execution time of a properly functioning application. If not managed, garbage collection can be one of the biggest bottlenecks for an application, especially when running on SMP server machines.
Garbage collection can be used to evaluate application performance health. By monitoring garbage collection during the execution of a fixed workload, users gain insight as to whether the application is over-utilizing objects. Garbage collection can even be used to detect the presence of memory leaks.
Use the garbage collection and heap statistics in Tivoli Performance Viewer (see "Tivoli Performance Viewer" on page 180 and "Monitoring an application" on page 183) to evaluate application performance health. By monitoring garbage collection, memory leaks and overly used objects can be detected.
For this type of investigation, set the minimum and maximum heap sizes to the same value. Choose a representative, repetitive workload that matches production usage as closely as possible, user errors included. To ensure meaningful statistics, run the fixed workload until the state of the application is steady. Reaching this state usually takes several minutes.
Detecting over-utilization of objects
To see if the application is overusing objects, look in Tivoli Performance Viewer at the counters for the JVMPI profiler. The average time between garbage collection calls should be five to six times the average duration of a single garbage collection. If not, the application is spending more than 15 percent of its time in garbage collection. Also, look at the numbers of freed, allocated, and moved objects.
If the information indicates a garbage collection bottleneck, there are two ways to clear the bottleneck. The most cost-effective way to optimize the application is to implement object caches and pools. Use a Java profiler to determine which objects to target. If the application cannot be optimized, adding memory, processors, and application clusters might help. Additional memory allows each application server in a cluster to maintain a reasonable heap size. Additional processors allow the cluster members to run in parallel.
Detecting memory leaks
Memory leaks in Java are a dangerous contributor to garbage collection bottlenecks. Memory leaks are more damaging than memory overuse, because a memory leak ultimately leads to system instability. Over time, garbage collection occurs more frequently until finally the heap is exhausted and Java fails with a fatal Out of Memory exception.
Memory leaks occur when an unneeded object has references that are never deleted. This most commonly occurs in collection classes, such as Hash table, because the table itself always has a reference to the object, even after real references have been deleted.
Memory leaks must be fixed. The best way to fix a memory leak is to use a Java profiler that allows you to count the number of object instances. Object counts that exhibit unbounded growth over time indicate a memory leak.
The following considerations apply to memory leaks:
-
Long-running test: Memory leak problems manifest only after a period of time; therefore, recognizing memory leaks is related to long-running tests.
-
System test: Some memory leak problems occur only when different components of a big project are combined and executed.
-
Repetitive test: In many cases, memory leak problems occur by successive repetitions of the same test case. Repetitive tests can be used at the system level or module level.
-
Concurrency test: Some memory leak problems can occur only when there are several threads running in the application.
Tivoli Performance Viewer helps to find memory leaks. For best results, repeat experiments with increasing duration, such as 1000, 2000, and 4000-page requests. The Tivoli Performance Viewer graph of used memory should have a sawtooth shape. Each drop on the graph corresponds to a garbage collection. There is a memory leak if one of the following occurs:
-
The amount of memory used immediately after each garbage collection increases significantly. The sawtooth pattern will look more like a staircase.
-
The sawtooth pattern has an irregular shape.
Also, look at the difference between the number of objects allocated and the number of objects freed. If the gap between the two increases over time, there is a memory leak.
Heap fragmentation
If heap consumption indicates a possible leak during a heavy workload (the application server is consistently near 100 percent CPU utilization), yet the heap appears to recover during a subsequent lighter or near-idle workload, this is an indication of heap fragmentation.
Heap fragmentation can occur when the JVM is able to free sufficient objects to satisfy memory allocation requests during garbage collection cycles, but does not have the time to compact small free memory areas in the heap into larger contiguous spaces. Another form of heap fragmentation occurs when small objects (less than 512 bytes) are freed. The objects are freed, but the storage is not recovered, resulting in memory fragmentation.
Heap fragmentation can be avoided by turning on the -Xcompactgc flag in the JVM advanced settings command line arguments. The -Xcompactgc ensures that each garbage collection cycle eliminates fragmentation, but with a small performance penalty.
Java heap parameters
The Java heap parameters also influence the behavior of garbage collection. Increasing the heap size allows more objects to be created. Because a large heap takes longer to fill, the application runs longer before a garbage collection occurs. However, a larger heap also takes longer to compact and causes garbage collection to take longer.
For performance analysis, the initial and maximum heap sizes should be equal. When tuning a production system where the working set size of the Java application is not understood, a good starting value is to let the initial heap size be 25 percent of the maximum heap size. The JVM will then try to adapt the size of the heap to the working set size of the application.
Run a series of test experiments that vary the Java heap settings. For example, run experiments with 128 MB, 192 MB, 256 MB, and 320 MB. During each experiment, monitor the total memory usage. If the heap is expanded too aggressively, paging can occur. (Use the vmstat command or the Windows NT or 2000 Performance Monitor to check for paging.) If paging occurs, reduce the size of the heap or add more memory to the system. When all the runs are finished, compare the following statistics:
-
Number of garbage collection calls
-
Average duration of a single garbage collection call
-
Ratio between the length of a single garbage collection call and the average time between calls
If the application is not over-utilizing objects and has no memory leaks, a state of steady memory utilization is reached. Garbage collection also occurs less frequently and for shorter durations.
6.3.5 Application assembly considerations
Application assembly tools are used to assemble J2EE components and modules into J2EE applications. Generally, this consists of defining application components and their attributes, including enterprise beans, servlets and resource references. Many of these application configuration settings and attributes play an important role in the runtime performance of the deployed application. The most important parameters and advice for finding optimal settings are:
-
Enterprise bean modules
-
Entity EJBs - Bean cache
-
Entity EJBs (EJB 2.0) - Access intent
-
Entity EJB Method extensions (EJB 1.1)
-
Isolation level
-
Access intent
-
-
Container transactions
-
-
Web modules
-
Web application - Distributable
-
Web application - Reload interval
-
Web application - Reload enabled
-
Web application - Web components - Load on startup
-
Enterprise bean modules
This section explains the enterprise bean module parameters mentioned above, in detail.
Entity EJBs - Bean cache
WebSphere Application Server provides significant flexibility in the management of database data with Entity EJBs. The Entity EJBs Activate at and Load at configuration settings specify how and when to load and cache data from the corresponding database row data of an enterprise bean. These configuration settings provide the capability to specify enterprise bean caching Options A, B or C.
Option A provides maximum enterprise bean performance by caching database data outside of the transaction scope. Generally, Option A is only applicable where the EJB container has exclusive access to the given database. Otherwise, data integrity is compromised. Option B provides more aggressive caching of Entity EJB object instances, which can result in improved performance over Option C, but also results in greater memory usage. Option C is the most common real-world configuration for Entity EJBs.
-
Bean cache - Activate at
This setting specifies the point at which an enterprise bean is activated and placed in the cache. Removal from the cache and passivation are also governed by this setting. Valid values are Once and Transaction. Once indicates that the bean is activated when it is first accessed in the server process, and passivated (and removed from the cache) at the discretion of the container, for example, when the cache becomes full. Transaction indicates that the bean is activated at the start of a transaction and passivated (and removed from the cache) at the end of the transaction. The default value is Transaction.
-
Bean cache - Load at
This setting specifies when the bean loads its state from the database. The value of this property implies whether the container has exclusive or shared access to the database. Valid values are Activation and Transaction.
Activation indicates the bean is loaded when it is activated and implies that the container has exclusive access to the database. Transaction indicates that the bean is loaded at the start of a transaction and implies that the container has shared access to the database. The default is Transaction.
The settings of the Activate at and Load at properties govern which commit options are used.
-
For Option A (exclusive database access), use Activate at = Once and Load at = Activation.
This option reduces database input/output by avoiding calls to the ejbLoad function, but serializes all transactions accessing the bean instance. Option A can increase memory usage by maintaining more objects in the cache, but can provide better response time if bean instances are not generally accessed concurrently by multiple transactions.
Note When using WebSphere Network Deployment and workload management is enabled, Option A cannot be used. You must use settings that result in the use of Options B or C.
-
For Option B (shared database access), use Activate at = Once and Load at = Transaction.
Option B can increase memory usage by maintaining more objects in the cache. However, because each transaction creates its own copy of an object, there can be multiple copies of an instance in memory at any given time (one per transaction), requiring the database be accessed at each transaction. If an enterprise bean contains a significant number of calls to the ejbActivate function, using Option B can be beneficial because the required object is already in the cache. Otherwise, this option does not provide significant benefit over Option A.
-
For Option C (shared database access), use Activate at = Transaction and Load at = Transaction.
This option can reduce memory usage by maintaining fewer objects in the cache. However, there can be multiple copies of an instance in memory at any given time (one per transaction). This option can reduce transaction contention for enterprise bean instances that are accessed concurrently but not updated.
| Note | The following information refers to EJB 1.1 settings. |
Method extensions - Isolation level
WebSphere Application Server enterprise bean method extensions provide settings to specify the level of transactional isolation used when accessing data.
Isolation level settings specify various degrees of runtime data integrity provided by the corresponding database. First choose a setting that meets data integrity requirements for the given application.
The valid values are:
-
Serializable
-
Repeatable read
-
Read committed
-
Read uncommitted
Isolation level also plays an important role in performance. Higher isolation levels reduce performance by increasing row locking and database overhead while reducing data access concurrency. Various databases provide different behavior with respect to the isolation settings.
The isolation level can be specified at the bean or method level. Therefore, it is possible to configure different isolation level settings for various methods. This is an advantage when some methods require higher isolation than others, and can be used to achieve maximum performance while maintaining integrity requirements. However, isolation cannot change between method calls within a single enterprise bean transaction. A runtime exception will be thrown in this case.
The following section describes the four isolation levels:
-
Serializable
This level prohibits the following types of reads:
-
Dirty reads: A transaction reads a database row containing uncommitted changes from a second transaction.
-
Non-repeatable reads: One transaction reads a row, a second transaction changes the same row, and the first transaction re-reads the row and gets a different value.
-
Phantom reads: One transaction reads all rows that satisfy an SQL WHERE condition, a second transaction inserts a row that also satisfies the WHERE condition, and the first transaction applies the same WHERE condition and gets the row inserted by the second transaction.
-
-
Repeatable read
This level prohibits dirty reads and nonrepeatable reads, but it allows phantom reads.
-
Read committed
This level prohibits dirty reads, but allows nonrepeatable reads and phantom reads.
-
Read uncommitted
This level allows dirty reads, nonrepeatable reads, and phantom reads.
The container uses the transaction isolation level attribute as follows:
-
Session beans and entity beans with bean-managed persistence (BMP)
For each database connection used by the bean, the container sets the transaction isolation level at the start of each transaction unless the bean explicitly sets the isolation level on the connection.
-
Entity beans with container-managed persistence (CMP)
The container generates database access code that implements the specified isolation level.
Method extensions - Access intent
WebSphere Application Server enterprise bean method extensions provide settings to specify individual enterprise bean methods as read-only. This setting denotes whether the method can update entity attribute data (or invoke other methods that can update data in the same transaction).
| Note | This setting is applicable only for EJB 1.x-compliant beans, that is:
To specify the access intent for EJB 2.x-compliant beans, select an access intent policy. |
By default, all enterprise bean methods are assumed to be "update" methods. This results in EJB Entity data always being persisted back to the database at the close of the enterprise bean transaction. Marking enterprise methods that do not update entity attributes as Access Intent Read provides a significant performance improvement by allowing the WebSphere Application Server EJB container to skip the unnecessary database update.
A behavior for "finder" methods for CMP Entity EJBs is available. By default, WebSphere Application Server will invoke a Select for Update query for CMP enterprise bean finder methods such as findByPrimaryKey. This exclusively locks the database row for the duration of the enterprise bean transaction. However, if the enterprise bean finder method has been marked as Access Intent Read, the container will not issue the For Update on the select, resulting in only a read lock on the database row.
For EJB 2.0, please see Chapter 8, "DB2 UDB V8 and WAS V5 integrated performance" on page 287, for more information.
Web module
This section explains the parameters that can be set for Web modules.
Web application - Distributable
The distributable flag for J2EE Web applications specifies that the Web application is programmed to be deployed in a distributed servlet container. Web applications should be marked as Distributable if, and only if, they will be deployed in a WebSphere Application Server clustered environment.
Web application - Reload interval
The reload interval specifies a time interval, in seconds, in which the Web application's file system is scanned for updated files, such as servlet class files or JSPs.
The Reload interval can be defined at different levels for various application components. Generally, the reload interval specifies the time the application server will wait between checks to see if dependent files have been updated and need to be reloaded. Checking file system time stamps is an expensive operation and should be reduced. The default is 0 (zero). Setting this to a value of 3 seconds is good for a test environment, because the Web site can be updated without restarting the application server. In production environments, checking a few times a day is a more common setting.
Web application - Reloading enabled
This specifies whether file reloading is enabled. The default is false.
Web application - Web components - Load on startup
Indicates whether a servlet is to be loaded at the startup of the Web application. The default is false.
Many servlets perform resource allocation and other up-front processing in the servlet init() method. These initialization routines can be costly at runtime. By specifying Load on startup for these servlets, processing takes place when the application server is started. This avoids runtime delays, which can be encountered on a servlet's initial access.
6.3.6 Other considerations
Besides the considerations mentioned above, the following considerations also have significant impact on the WebSphere Application Server system.
Hardware considerations
Hardware configurations used by WebSphere Application Server will obviously have significant impact on performance.
-
Processor speed: Increasing the processor speed often helps throughput and response times once other bottlenecks have been removed where the processor is waiting on events like input/output and application concurrency. In this case, increasing the processor speed often helps throughput and response times.
-
System memory: In general, increasing memory to prevent the system from paging memory to disk is likely to improve performance. Allow at least 512 MB memory for each processor. Try adjusting the parameter when the system is paging (and processor utilization is low because of the paging).
-
Disk speed and configuration can have a dramatic effect on the performance of application servers that run applications that are heavily dependent on database support, that use extensive messaging, or are processing workflow. Using disk I/O subsystems that are optimized for performance (for example, RAID array) are essential components for optimum application server performance in these environments. It is recommended that you spread the disk processing across as many disks as possible to avoid contention issues that typically occur with one or two disk systems.
Network considerations
Run network cards and network switches at full duplex. Running at half duplex decreases performance. Verify that the network speed can accommodate the required throughput. Make sure that 100 MB is in use on 10/100 Ethernet networks.
Operation system tuning
To get a good performance, tuning operating system parameters for AIX, Sun Solaris, and Windows NT/2000 is also very important. For more details please refer to the WebSphere InfoCenter. Expand Monitoring and troubleshooting -> Performance -> Tuning Performance, then select Tuning parameter index -> Operating system.
IBM HTTP server
We have discussed tuning the HTTP server from the WebSphere Queue network perspective. In this section we discuss some important HTTP server parameters that are not mentioned in "WebSphere Queuing Network" on page 193.
Access logs
All incoming HTTP requests are logged here. Logging degrades performance because I/O operation overhead causes logs to grow significantly in a short time. To turn logging on or off, edit the IBM HTTP Server httpd.conf file, located in the directory <IBM HTTP Server Home>/conf. Search for a line with the text CustomLog. Comment out this line, then save and close the httpd.conf. file. Stop and restart the IBM HTTP Server. By default, logging is enabled, but for better performance it is recommended that you disable the access logs.
MinSpareServers, MaxSpareServers, and StartServers
Pre-allocates and maintains the specified number of processes so that few processes are created and destroyed as the load approaches the specified number of processes (based on MinSpareServers). Specifying similar values reduces the CPU usage for creating and destroying HTTPD processes. Adjust this parameter if the time waiting for IBM HTTP Server to start more servers so that it can handle HTTP requests is not acceptable.
For optimum performance, specify the same value for the MaxSpareServers and the StartServers parameters. If MaxSpareServers is set to less than MinSpareServers, IBM HTTP Server resets MaxSpareServer=MinSpareServer+1. Setting the StartServers too high can cause swapping if memory is not sufficient, degrading performance.
To view or change these values, edit the following directives in the file httpd.conf, located in the directory <IBM HTTP Server Home>/conf:
-
MinSpareServers
-
MaxSpareServers
-
StartServers
IBM HTTP Server - Linux
The following instructions are important when running the IBM HTTP Server on Linux.
MaxRequestsPerChild
The MaxRequestsPerChild directive sets the limit on the number of requests that an individual child server process handles. After the number of requests reaches the value set for the MaxRequestsPerChild parameter, the child process dies. If there are no known memory leaks with Apache and Apache's libraries, set this value to zero (0).
To change this value, edit the IBM HTTP server file httpd.conf located in the directory <IBM HTTP Server Home>/conf. Change the value of the MaxRequestsPerChild parameter. Save the changes and restart the IBM HTTP server. By default, this value is set to 500.
Object Request Broker (ORB)
Several settings are available for controlling internal Object Request Broker (ORB) processing. You can use these to improve application performance in the case of applications containing enterprise beans.
You can change these settings for the default server or any application server configured in the administrative domain from the Administrative Console.
Pass by value versus Pass by reference
This is specified in property com.ibm.CORBA.iiop.noLocalCopies. For EJB 1.1 beans, the EJB 1.1 specification states that method calls are to be Pass by value. For every remote method call, the parameters are copied onto the stack before the call is made. This can be expensive. The Pass by reference, which passes the original object reference without making a copy of the object, can be specified.
For EJB 2.0 beans, interfaces can be local or remote. For local interfaces, method calls are Pass by reference, by default.
If the EJB client and EJB server are installed in the same WebSphere Application Server instance, and the client and server use remote interfaces, specifying Pass by reference can improve performance up to 50 percent.
Please note that Pass by reference helps performance only when non-primitive object types are being passed as parameters. Therefore, data type int and floats are always copied, regardless of the call model.
| Important: | Pass by reference can be dangerous and can lead to unexpected results. If an object reference is modified by the remote method, the change might be seen by the caller. |
Use the Administrative Console to set this value:
-
Select Servers -> Application Servers.
-
Select the application server you wish to change.
-
Select ORB Service from Additional Properties.
-
Select the check box Pass by Reference.
-
Click OK and Apply to save the changes.
-
Stop and restart the application server.
The default is Pass by value for remote interfaces and Pass by reference for EJB 2.0 local interfaces.
If the application server expects a large workload for enterprise bean requests, the ORB configuration is critical. Take note of the following properties.
com.ibm.CORBA.ServerSocketQueueDepth
This property corresponds to the length of the TCP/IP stack listen queue and prevents WebSphere Application Server from rejecting requests when there is no space in the listen queue.
If there are many simultaneous clients connecting to the server-side ORB, this parameter can be increased to support the heavy load up to 1000 clients. The default value is 50.
To set the property, follow these steps:
-
Select Servers -> Application Servers.
-
Click the application server you want to tune.
-
Select Process Definition under Additional Properties.
-
Select Java Virtual Machine under Additional Properties.
-
Enter -Dcom.ibm.CORBA.ServerSocketQueueDepth=200 in the Generic JVM Properties field.
Object Request Broker connection cache maximum
This property is also called com.ibm.CORBA.MaxOpenConnection and corresponds to the size of the ORB connection table. The property sets the standard for the number of simultaneous ORB connections that can be processed.
If there are many simultaneous clients connecting to the server-side ORB, this parameter can be increased to support the heavy load up to 1000 clients. The default value is 240. To change this value:
-
Select Servers -> Application Servers.
-
Select the application server you want to tune.
-
Select ORB Service under Additional Properties.
-
Update the Connection cache maximum field and click OK.
-
Click Apply to save the changes then restart the application server.
ORB thread pool size
Please see "EJB container" on page 202 for details.
Dynamic Cache Service
The Dynamic Cache Service improves performance by caching the output of servlets, commands and JavaServer Pages (JSP) files. WebSphere Application Server consolidates several caching activities, including servlets, Web services, and WebSphere commands into one service called the dynamic cache. These caching activities work together to improve application performance, and share many configuration parameters, which are set in an application server's dynamic cache service.
The dynamic cache works within an application server Java Virtual Machine (JVM), intercepting calls to cacheable objects, for example, through a servlet's service() method or a command's execute() method, and either stores the object's output to or serves the object's content from the dynamic cache. Because J2EE applications have high read/write ratios and can tolerate small degrees of latency in the currency of their data, the dynamic cache can create an opportunity for significant gains in server response time, throughput, and scalability.
See "Dynamic Cache Monitor" on page 192 or the InfoCenter article "Improving performance through the dynamic cache service" for more information.
6.3.7 Application best practice for performance
To have a good performance for a WebSphere Application Server system, the J2EE application must perform well. In this section we discuss the best practices when writing a WebSphere Application Server application that includes servlets, JSPs, JDBC connections, and EJBs for performance.
General design considerations
To make a J2EE application perform well, as a prerequisite you must ensure that your application has a good design and architecture.
Using proven patterns
It is important to reuse existing patterns and algorithms where appropriate, rather than "reinventing the wheel". There are established algorithms and approaches for solving many of the commonly encountered problems in computer science, and any decision to use a custom solution in preference to one of these commonly used solutions should be made with caution.
Reuse the resources
J2EE applications spend much time fetching, creating, or destroying some complex objects or resources. Others may be too expensive for a single application to maintain on a one-to-one basis. Therefore, you should create a limited number of the resource, and share them from a common pool. You can pool many types of resources, from complex objects to connections. J2EE will manage some of these for you. For example, J2EE connection pools can improve performance by an order of magnitude for extreme cases. For others, you will have to create and manage the pool yourself.
Memory
A key factor in the performance of any Java application and hence any WebSphere Application Server application is the use of memory. Unlike other programming languages, Java does not require (or even allow) programmers to explicitly allocate and reclaim memory. The Java Virtual Machine (JVM) runtime environment will allocate memory when a new object is created, and will reclaim the memory once there are no more references to the object. This reduces the amount of coding required, as well as minimizing the potential for memory "leaks" caused by the programmer forgetting to deallocate memory once it is no longer required. Additionally, Java does not allow pointer arithmetic. Memory deallocation is performed by a thread executing in the JVM called the garbage collector (GC). The algorithm used for garbage collection is not specified in the Java Virtual Machine specification, and hence different JVM implementations may use different garbage collection algorithms.
Although Java performs memory management automatically, programmers still need to be aware of the impact of memory management on performance. Creating an object consumes system resources, because the JVM must allocate memory and initialize the object. Similarly, reclaiming memory using the garbage collector also uses resources, particularly CPU time. Garbage collection occurs asynchronously when free memory reaches threshold values, and it cannot be explicitly scheduled programmatically. A call to the System.gc() method will request that the JVM performs garbage collection. However, this is not guaranteed to happen immediately or within any specified time period.
Hence, the key to minimizing the performance impact of memory management is to minimize memory usage, particularly object creation and destruction. This can be achieved by a number of means:
-
Object creation
Do not create objects prematurely if there is a possibility that they will not be needed. For example, if the object is only used in one path of an if statement, then create the object inside that path rather that outside the if statement—lazy initialization. If the same object can be reused inside a loop body, then declare and instantiate it outside the loop rather than inside the loop, to avoid creating and destroying a number of objects of the same class.
-
Object pools
If objects of the same class are being repeatedly created and destroyed, it can be beneficial to create an object pool that allows the objects to be reused. Classes whose objects will be used in a pool need an initializer, so that objects obtained from the pool have some known initial state. It is also important to create a well-defined interface to the pool to allow control over how it is used.
-
Appropriate sizing for collections
Although the Java runtime environment will dynamically grow the size of collections such as java.util.Vector or Java.util.Hashtable, it is more efficient if they are appropriately sized when created. Each time the collection size is increased, its size is doubled, so when the collection reaches a stable size it is likely that its actual size will be significantly greater than required. The collection only contains references to objects rather than the objects themselves, which minimizes the over allocation of memory due to this behavior.
-
Temporary objects
Developers should be aware that some methods such as toString() methods can typically create a large number of temporary objects. Many of the objects may be created in code that you do not write yourself, such as library code that is called by the application.
-
Use of static and final variables
When a value is used repeatedly and is known at compile time, it should be declared with the static and final modifiers. This will ensure that it will be substituted for the actual value by the compiler. If a value is used repeatedly but can be determined only at runtime, it can be declared as static and referenced elsewhere to ensure that only one object is created. Note that the scope of static variables is limited to the JVM. Hence if the application is cloned, care needs to be taken to ensure that static variables used in this way are initialized to the same value in each JVM. A good way of achieving this is the use of a singleton object. For example, an EJB initial context can be cached with a singleton using the following code fragment (Example 6-5).
Example 6-5: Use of singleton to cache EJB initial context references
public class EJBHelper { private static javax.naming.InitialContext initialContext= null; public javax.naming.InitialContext getInitialContext() { if (initialContext = null) initialContext = new javax.naming.InitialContext(); return initial Context; } } -
Object references
Although memory does not have to be explicitly deallocated, it is still possible to effectively have "memory leaks" due to references to objects being retained even though they are no longer required. These objects are commonly referred to as loitering objects. Object references should be cleared once they are no longer required, rather than waiting for the reference to be implicitly removed when the variable is out of scope. This allows objects to be reclaimed sooner.
Care should be taken with objects in a collection, particularly if the collection is being used as a type of cache. In this case, some criteria for removing objects from the cache is required to avoid the memory usage constantly growing. Another common source of memory leaks in Java is due to programmers not closing resources such as Java Database Connectivity (JDBC), Java Message Service (JMS), and Java Connector Architecture (JCA) resources when they are no longer required, particularly under error conditions. It is also important that static references be explicitly cleared when no longer required, because static fields will never go out of scope. Since WebSphere Application Server applications typically run for a long time, even a small memory leak can cause the Java Virtual Machine to run out of free memory.
An object that is referenced but no longer required may in turn refer to other objects, so that a single object reference can result in a large tree of objects that cannot be reclaimed. The profiling tools available in IBM WebSphere Studio Application Developer V5 can help to identify memory leaks. Other tools that can be used for this purpose include Rational Purify®, Sitraka JProbe (by Quest Software), and Borland OptimizeIt.
-
Vertical clustering
Most current garbage collection implementations are partially single threaded (during the heap compaction phase). This causes all other program threads to stop, potentially increasing the response times experienced by users of the application. The length of each garbage collection call is dependent on numerous factors, including the heap size and number of objects in the heap. Thus as the heap grows larger, garbage collection times can increase, potentially causing erratic response times depending on whether a garbage collection occurred during a particular interaction with the server. The effect of this can be reduced by using vertical scaling and running multiple copies of the application on the same hardware. This can provide two benefits: First, the JVM for each member of the cluster will only require a smaller heap; and secondly, it is likely that while one JVM is performing garbage collection, the other one will be able to service client requests as the garbage collection cycles of the JVMs are not synchronized in any way. However, any client requests that have been directed by workload management to the JVM (doing garbage collection) will be affected.
Session management
In a Web application, state information relating to each client is typically stored in an HTTP session, which is identified by some unique identifier that is associated with an HTTP cookie. In an environment with a single application server, session information can be stored in-memory by WebSphere Application Server V5. However, it is more common to use a clustered environment with multiple application servers to provide scalability and improve fault tolerance.
In this cluster scenario, session information needs to be made available across all of the cluster members. In past versions of WebSphere Application Server, this was achieved using a session persistence database that was available to all clones in a server group. In addition to this, a new mechanism for memory-to-memory replication has been introduced in IBM WebSphere Application Server V5.
In either case, it is beneficial to minimize the amount of data stored in the session. Since the session must be shared, it must be serialized, which also involves serializing all objects that are reachable from the session. Serialization in Java is an expensive operation. If persistent sessions are used, the serialized session data must be stored in the database, which introduces further overhead. Usually the session is stored as a binary data type (BLOB) in the database, which also may introduce overhead. If memory-to-memory replication is used, there is still overhead associated with serializing and transmitting the session data.
In order to reduce the amount of data stored in the session, avoid storing large, complex object graphs in it. In some cases it may be beneficial to store objects in the session, although they can be recreated or retrieved to avoid the overhead of doing so. In these cases, consideration should be given to making these attributes transient. If this is done, you have to ensure that the application code will handle the transient attributes having null values. Alternatively, the readObject() method of the object could be overwritten to recreate the transient data when the object is deserialized.
The session object can be garbage collected after it has been invalidated. This can be done programmatically or after a predefined timeout period during which the session was not accessed. To allow the memory used by the session to be reclaimed as early as possible, it is best to explicitly invalidate the session when finished with it rather than waiting for the timeout. This may require the introduction of logout functionality into the application, and training for the users to make use of this functionality rather than simply closing the browser.
References to the session should always be obtained from the current servlet context as required; they should not be cached by the application. This ensures that the session objects can be reclaimed when the session is invalidated. Another reason for doing this is because a session reference is not guaranteed to be valid outside of the context of a specific server interaction.
Special care must be taken when using HTML frames when each frame is displaying a JSP belonging to a different Web application on the same server. In this case, a session should only be created and accessed by one of the pages. Otherwise, although a session will be created for each page, the same cookie will be used to identify the session. This means that the cookie for each newly created session will overwrite the previous cookie, and only one of the sessions will be accessible. The remaining sessions will be created but will be inaccessible and thus will consume memory until the timeout interval is reached. If the Web application was split into multiple applications in order to improve scalability, consider combining all of the Web applications into a single one, and using clustering to achieve the required scalability.
There are alternatives to the use of the session that may be appropriate in some situations:
-
In some cases use of the session can be avoided by using hidden form fields or cookies to store data. Note that there is a 4-KB limit on the total size of all cookies for a particular site. Also be aware that the use of hidden fields increases the page size and the data can be seen by the user when viewing the HTML source.
-
Data can be stored directly in a database by the application. By using native data types instead of serialized BLOBs, it is often possible to achieve better performance. It is also possible to read and write only the data that has changed, rather than the entire data set as is normally the case with BLOBs. The application will need to remove data when it is no longer required (including after a timeout period). This can be implemented by placing an object that implements the HttpSessionBindingListener interface into the session, and placing the clean up code in the valueUnBound() method.
-
Entity EJBs can be used to store session data. However, the performance implications of this approach need to be assessed before implementing this type of solution. In particular, this may not perform well if complex data structures need to be stored.
Synchronization
The mechanism by which access to shared resources by different threads is controlled is called synchronization. While the synchronization functionality in Java is convenient and easy to use, it can introduce significant performance overhead. When a block of code is synchronized, only a single thread can execute it at any one time. There are two performance impacts of synchronization:
-
Managing the monitors, the objects internal to the JVM that are used to control access to synchronized resources. Although they are not explicitly accessible by programmers, there is an overhead due to the management of the monitors by the JVM.
-
Reduced concurrency, since threads have to wait for other threads to exit from synchronized blocks of code.
When using synchronization, it is best to use specific lock objects to synchronize on. Synchronizing using the keyword can cause different methods to be unnecessarily synchronized with each other, and hence reduce concurrency. Note that synchronizing on an object has a greater overhead than calling a synchronized method. However, synchronizing the method may result in significantly greater amounts of code being synchronized, again reducing the concurrency. So the trade-off between the synchronization overhead and reduced concurrency needs to be evaluated on a case-by-case basis.
In addition to the explicit use of synchronization in application code, synchronization may be used indirectly, as some of the commonly used core Java functionality uses synchronization. Some particular examples are:
-
The Java I/O libraries. It is best to minimize the use of System.out.println() for this reason. Use of a multi-threaded logging library is suggested.
-
Some of the Java collection classes, such as java.util.Hashtable and java.util.Vector, are synchronized. If only a single thread is accessing the data (or multiple threads are reading only), the synchronization overhead is unnecessary. Many of the newer collections introduced in Java 1.2, such as java.util.ArrayList, are not synchronized and may provide better performance. However, care needs to be taken when accessing them from multiple threads.
Servlets and JavaServer Pages
Since servlets and JavaServer Pages (JSPs) can include Java code, many of the issues discussed in other sections of this chapter are relevant for JSPs as well. However, there are some particular issues that need to be considered when developing JSPs:
-
Minimize the use of the <jsp:include> tag, since each included JSP is a separate servlet.
-
When a <jsp:usebean> tag is encountered and an existing Java bean object with the appropriate name does not exist, a new one is created. This is done by a call to Beans.instantiate(), which is an expensive operation because the JVM checks the file system for a serialized bean. Hence it is recommended that the <jsp:usebean> tag only be used to obtain a reference to an existing object, rather than for creating a new object.
-
In accordance with the Java 2 Enterprise Edition (J2EE) specification, when executing a JSP, a session object is normally created implicitly if one does not already exist. However, if the session is not required, creation can be avoided by the use of the <%@ page session="false" %> directive.
-
Avoid the use of the SingleThreadModel for servlets, since it permits only one servlet thread to be executing at any time. Other client requests will be queued, waiting until a servlet to process them becomes available. This reduced concurrency can significantly reduce the throughput, and consequently increase the response times experienced by users. If a servlet has shared variables that need to be protected, it is preferable to do so using synchronization of the relevant accesses. The SingleThreadModel is effectively equivalent to synchronizing the servlets' entire service() method.
-
The javax.servlet.Servlet.init() method can be used to perform expensive operations that need to be performed once only, rather than using the doGet() or doPost() methods of the servlet.
Logging
The Java I/O classes use synchronization. Hence System.out.println() should not be used for logging purposes. If a lot of output using stdout is generated by an application in a UNIX environment, the overhead can be avoided by redirecting stdout to /dev/null in the production environment. However, a better approach is to use a multithreaded logging library such as the WebSphere logging facilities or Log4J (http://jakarta.apache.org/log4j/). In addition to providing better performance due to their multithreaded implementations, these libraries allow logging statements to be defined at a particular level, which can be dynamically changed at runtime. Thus the amount of logging in production environments can be reduced in comparison to development and test environments without requiring code changes, improving the performance of the application. It is also good practice to guard log statements so that the parameters are not evaluated if the logging level is not on. The use of guard statements is shown in Example 6-6.
Example 6-6: Use of gaurd statements for logging
if (Log.isLogging(Log.WARN) { Log.log(LOG.WARN, "This is a warning"); }
Enterprise JavaBeans
Enterprise JavaBeans (EJBs) are an important aspect of the J2EE specification, and appropriate use of EJBs can support the development of modular and scalable applications. There are, however, a number of performance considerations that need to be taken into account when using EJBs:
-
Obtaining EJB references
Since EJBs are able to be accessed remotely, obtaining a reference to an EJB involves a lookup process. This can take a relatively long time, and hence caching the references obtained can improve performance on subsequent lookup operations. Obtaining an EJB reference typically involves the following steps:
-
Obtain an InitialContext instance.
-
Obtain a reference to the home interface of a particular EJB by looking up the EJB via the initial context object and performing a narrow operation.
-
Obtain a particular EJB instance by executing the appropriate finder or create method from the EJB home instance.
The calls to obtain an InitialContext instance and lookup of an EJB Home instance (steps a and b) are expensive, and performance can be improved by caching these objects. References to EJB homes may become stale, and hence it is best to wrap accesses to EJB Home methods with code that refreshes stale references.
Because the WebSphere Application Server provides caching of homes automatically, application-level caching is no longer required. So for WebSphere Application Server V5, it may a good idea to implement a home factory without caching the EJB homes, but caching the initial context.
-
-
Remote method calls
Since EJBs are intended to be accessible remotely, calls to EJB method are implemented as remote calls even if the EJB exists in a container that shares the same JVM as the Web container, which introduces some overhead. In some cases, the overhead can be reduced by implementing the approaches outlined below.
-
Session facade
One of the key mechanisms to reduce EJB overhead is to minimize the number of remote calls. In general, a servlet should make a single EJB method call to a session bean to perform an operation. If required, this EJB method can call other methods as required to perform more complex operations. All access to Entity EJBs should be performed through stateless session beans. Session beans should be used to implement the business logic, while entity beans should be used for data storage and retrieval.
The EJB sample application, AccessEmployee, shipped with DB2 V8.1, is an example that utilizes session facade.
-
Using local interface
IBM WebSphere Application Server V5 is compliant with the J2EE 1.3 specifications, which mandate support for EJB 2.0. The concept of a local interface has been introduced for EJB 2.0. If local interfaces are used, the overhead of serializing the parameters and transmitting them via Remote Method Invocation/Internet Inter-ORB Protocol (RMI/IIOP) is avoided. Parameters can be passed by reference instead of value, avoiding the need to copy them. In EJB 2.0, an EJB can have a remote interface, local interface, or both, although typically a particular bean will have either a remote or a local interface. Since Entity EJBs are normally accessed from session beans, in most cases they will only need local interfaces.
-
-
Transaction management
In addition to the overhead associated with remote method calls, transaction management provided by the EJB container can also introduce overhead. Session facade can limit the impact of this by reducing the number of transactions. In the deployment descriptor for EJBs, the transaction type can be specified. This can be one of five values:
-
NotSupported
-
Supports
-
Required
-
Requires New
-
Mandatory
Set the transaction type to NotSupported if no transaction is required.
-
-
Entity EJBs
While entity beans can reduce the amount of coding work required by freeing programmers from having to write code for persisting data, care must be taken with the use of entity beans to avoid performance problems. As mentioned earlier, we recommend that using session facade to access entity beans, instead of directly by servlets or other clients. The EJB access beans functionality provided in IBM WebSphere Studio Application Developer V5 can also be used to simplify access to EJBs.
In cases where entity beans have deep relationships or significant use of inheritance, care must be taken to ensure that performance is adequate. If performance problems are encountered, they can potentially be addressed by reducing the use of inheritance in the model or by use of bean-managed persistence (BMP) in preference to container-managed persistence (CMP). Another strategy is to avoid turning each entity (table) into a single EJB. In some cases two or more related entities can be represented by a single EJB.
Important: The following applies only to EJBs that are compliant with the EJB 1.1 specification. We recommend that new EJBs be developed to be compliant with the EJB 2.0 specification. However, some existing EJBs may only be compliant with EJB 1.1
Entity EJBs are best used for manipulating small amounts of data. Returning large result sets from (default) EJB finders can be inefficient and it is often better to use JDBC directly from a session bean for this.
-
Isolation levels and read-only methods
If an entity bean has methods that do not update attributes (getter type methods) they can be specified as read-only methods in the deployment description. This will avoid executing a SELECT for UPDATE/UPDATE pair of SQL statements, and hence will provide a performance improvement. EJBs deployed in WebSphere Application Server can be assigned one of four transaction isolation levels. These are Repeatable Read, Read Committed, Read Uncommitted and Serializable. The default level is Repeatable Read, but performance can be improved by the use of a lower isolation level such as Read Committed.
Note The following applies only to EJBs that are compliant with the EJB 2.0 specification.
-
Access intent
The access intent for each method of an EJB 2.0 CMP entity bean can be specified in the EJB deployment descriptor to provide hints to the EJB container about how the method will be used. The supported access intents are:
-
pessimistic update - Weakest Lock At Load
-
pessimistic update
-
optimistic update
-
pessimistic read
-
optimistic read
In general, read-only methods and optimistic locking will provide better performance. However, be careful with the use of optimistic locking since problems may only become apparent under heavy load and hence may not be found in development. For more information please refer to "Enable database persistence" on page 313.
-
-
-
Stateful session beans
The use of stateful session beans should be minimized (or avoided if possible). Unlike stateless session beans, they are not able to be workload managed or pooled. The EJB container may passivate inactive stateful session beans and activate them if they are referenced later. This involves serializing and deserializing the beans, which can impact the performance. In cases where stateful session beans are required, the occurrence of passivating the beans can be reduced by explicitly removing the beans when they are no longer required, rather than waiting for them to time out. One scenario in which stateful session beans may be useful is the implementation of a cache for application data. This may use JDBC or a BMP entity bean to retrieve the data to be cached.
-
EJB caching
The EJB container has three types of caching that can be performed for entity beans between transactions. Selection of the appropriate option requires an understanding of how the entity beans will be used, as there is a trade-off between minimizing database reads and supporting Workload Management (WLM).
-
Option A caching
With this option, it is assumed that the data represented by the EJB is exclusively accessed by the EJB container and is not accessed by other containers or by some mechanism that is external to the application server. Use of this option can improve performance, since the data does not have to be retrieved again from the database prior to each transaction. However, if option A caching is used, the entity bean cannot be clustered or participate in WLM.
-
Option B caching
The entity bean will remain in the cache throughout the transaction, but is reloaded at the start of each method call. This introduces the greatest overhead.
-
Option C caching
The entity bean will be reloaded at the beginning of each transaction. This is the default setting, and allows for a client to access a particular bean from any container.
-
-
Asychronous message processing
Asychronous Java Message Service (JMS) messages can be processed using message-driven beans (MDBs), which have been introduced in WebSphere Application Server V5. This avoids the need for developing individual server programs to receive and process incoming messages.
Database access
For the best practices in database access, please refer to "Application considerations for performance in database access" on page 332 for more information.
[1]We call them queues from a queueing theory perspective, but in reality they are thread pools.
|
| < Day Day Up > |
|
EAN: N/A
Pages: 90