6.2 Performance monitoring and analysis tools
|
| < Day Day Up > |
|
In this chapter we discuss tuning an existing WebSphere environment for performance and J2EE application best practices for performance. Performance tuning methodology and guidelines are also provided. We also cover the Performance Monitoring Infrastructure (PMI) and performance tuning and monitoring tools found in WebSphere Application Server V5.
6.1 Performance Monitoring Infrastructure
The Performance Monitoring Infrastructure (PMI) is a set of packages and libraries designed to assist with gathering, delivering, processing, and displaying performance data in WebSphere Application Server runtime components. In this section, we introduce the updated Performance Monitoring Infrastructure (PMI) in IBM WebSphere Application Server V5.
The PMI uses a client-server architecture. The server collects performance data from various WebSphere Application Server components. A client retrieves performance data from one or more servers and processes the data.
The PMI components and infrastructure have been extended and updated in WebSphere Application Server V5 to support the new management structure and to comply with the Performance Data Framework of the J2EE Management Specification.
PMI provides several types of interfaces to access performance data. A new JMX API is introduced in this version. Java Management Extensions (JMX) is a framework that provides a standard way of exposing Java resources (application servers, for example) to a system management infrastructure. The JMX framework allows a provider to implement functions, such as listing the configuration settings, and allows users to edit the settings. It also includes a notification layer that can be used by management applications to monitor events such as the startup of an application server.
The servlet and Java client interfaces are still available for compatibility with Versions 3.5.5+ and 4.0+. These PMI interfaces are used to create tools to help monitor and tune performance.
WebSphere Application Server V5 contains Tivoli Performance Viewer, a Java client that displays and monitors performance data.
PMI is composed of components for collecting performance data on the application server side and components for communicating between runtime components and between the clients and servers. The primary PMI components and related Management Beans (MBeans) are illustrated in Figure 6-1 on page 171.
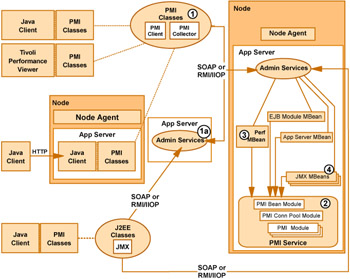
Figure 6-1: Performance monitoring components
Below we explain the above figure:
-
PMI Client API with its communications implementation, the PMI Collector. The PMI Client API initially contacts the Admin Service of the Deployment Manager (1a) to get a list of nodes, servers and MBeans for the entire cell.
-
PMI service consisting of PMI modules for collecting performance data and methods for instrumenting and retrieving the data from the runtime components. This service contacts the PMI modules upon application server startup, depending on the current configuration.
-
PerfMBean, a JMX management bean used to extract performance data from the PMI modules to the PMI Collector of the PMI Client API.
-
Extensions of the standard JMX MBeans (used for managing components and settings) to support management of performance data. This enables a JMX-based client to retrieve performance data.
The J2EE classes and PMI classes can use either the RMI over IIOP or SOAP protocol to communicate with the Admin Service. In a single-server environment the classes connect to the Admin Service of each individual application server in order to collect performance data. In a Network Deployment environment, the client can choose to connect to the Deployment Manager first to retrieve a list of nodes, servers and MBeans in the cell. Performance data retrieval is subsequently performed in the same way for the two environments.
6.1.1 Performance data organization
Performance Monitoring Infrastructure (PMI) provides server-side monitoring and a client-side API to retrieve performance data. PMI maintains statistical data within the entire WebSphere Application Server domain, including multiple nodes and servers. Each node can contain one or more WebSphere Application Servers. Each server organizes PMI data into modules and submodules.
The Tivoli Performance Viewer, formerly the Resource Analyzer, organizes performance data in a centralized hierarchy of the following objects:
-
Node
A node represents a physical machine in the WebSphere Application Server administrative domain.
-
Server
A server is a functional unit that provides services to clients over a network. No performance data is collected for the server itself.
-
Module
A module represents one of the resource categories for which collected data is reported to the performance viewer. Each module has a configuration file in XML format. This file determines organization and lists a unique identifier for each performance data in the module. Modules include enterprise beans, JDBC connection pools, J2C connection pool, Java Virtual Machine (JVM) runtime module (including Java Virtual Machine Profiler Interface (JVMPI)), servlet session manager, thread pools, transaction manager, Web applications, Object Request Broker (ORB), Workload Management (WLM), Web Services Gateway (WSGW), and dynamic cache.
-
Submodule
A submodule represents a fine granularity of a resource category under the module. For example, ORB thread pool is a submodule of the thread pool category. Submodules can contain other submodules.
-
Counter
A counter is a data type used to hold performance information for analysis. Each resource category (module) has an associated set of counters. The data points within a module are queried and distinguished by the Mbean ObjectNames or PerfDescriptors. Examples of counters include the number of active enterprise beans, the time spent responding to a servlet request and the number of kilobytes of available memory.
The Tivoli Performance Viewer allows users to view and manipulate the data for counters. A particular counter type can appear in several modules. For example, both the servlet and enterprise bean modules have a response time counter. In addition, a counter type can have multiple instances within a module. For example, in Figure 6-2, both the Enterprise beans module and Bean1 have an Avg Method RT counter.
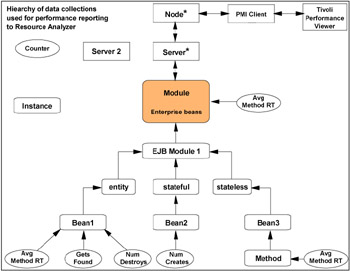
Figure 6-2: Example performance group hierarch
Counters are enabled at the module level and can be enabled or disabled for elements within the module. For example, in Figure 6-2, if the Enterprise beans module is enabled, its Avg Method RT counter is enabled by default. However, you can then disable the Avg Method RT counter even when the rest of the module counters are enabled. You can also, if desired, disable the Avg Method RT counter for Bean1, but the aggregate response time reported for the whole module will no longer include Bean1 data.
Each counter has a specified monitoring level: None, low, medium, high or maximum. If the module is set to a lower monitoring level than required by a particular counter, that counter will not be enabled. Thus, if Bean1 has a medium monitoring level, Gets Found and Num Destroys are enabled because they require a low monitoring level. However, Avg Method RT is not enabled because it requires a high monitoring level.
Data collection can affect performance of the application server. The impact depends on the number of counters enabled, the type of counters enabled, and the monitoring level set for the counters.
The following PMI modules are available to provide statistical data:
-
Enterprise bean module, enterprise bean, methods in a bean
Data counters for this category report load values, response times, and life cycle activities for enterprise beans. Examples include the average number of active beans and the number of times bean data is loaded or written to the database. Information is provided for enterprise bean methods and the remote interfaces used by an enterprise bean. Examples include the number of times a method is called and the average response time for the method. In addition, the Tivoli Performance Viewer reports information on the size and use of a bean objects cache or enterprise bean object pool. Examples include the number of calls attempting to retrieve an object from a pool and the number of times an object is found available in the pool.
-
JDBC connection pools
Data counters for this category contain usage information about connection pools for a database. Examples include the average size of the connection pool or number of connections, the average number of threads waiting for a connection, the average wait time in milliseconds for a connection, and the average time the connection is in use.
-
J2C connection pool
Data counters for this category contain usage information about the Java 2 Enterprise Edition (J2EE) Connector Architecture that enables enterprise beans to connect and interact with procedural back-end systems, such as Customer Information Control System (CICS) and Information Management System (IMS™). Examples include the number of managed connections or physical connections and the total number of connections or connection handles.
-
Java Virtual Machine API (JVM)
Data counters for this category contain memory used by a process as reported by Java Virtual Machine (JVM) run time. Examples are the total memory available and the amount of free memory for the JVM. JVM run time also includes data from the Java Machine Profiler Interface (JVMPI). This data provides detailed information about the JVM running the application server.
-
Servlet session manager
Data counters for this category contain usage information for HTTP sessions. Examples include the total number of accessed sessions, the average amount of time it takes for a session to perform a request, and the average number of concurrently active HTTP sessions.
-
Thread pool
Data counters for this category contain information about the thread pools for Object Request Broker (ORB) threads and the Web container pools used to process HTTP requests. Examples include the number of threads created and destroyed, the maximum number of pooled threads allowed, and the average number of active threads in the pool.
-
Java Transaction API (JTA)
Data counters for this category contain performance information for the transaction manager. Examples include the average number of active transactions, the average duration of transactions, and the average number of methods per transaction.
-
Web applications, servlet
Data counters for this category contain information for the selected server. Examples include the number of loaded servlets, the average response time for completed requests, and the number of requests for the servlet.
-
Object Request Broker (ORB)
Data counters for this category contain information for the ORB. Examples include the object reference lookup time, the total number of requests, and the processing time for each interceptor.
-
Web Services Gateway (WSGW)
Data counters for this category contain information for WSGW. Examples include the number of synchronous and asynchronous requests and responses.
-
System data
Data counters for this category contain information for a machine (node). Examples include the CPU utilization and memory usage. Note that this category is available at node level, which means it is only available at NodeAgent in the multiple servers version.
-
Workload Management (WLM)
Data counters for this category contain information for workload management. Examples include the number of requests, the number of updates, and the average response time.
-
Dynamic cache
Data counters for this category contain information for the dynamic cache service. Examples include in memory cache size, number of invalidations, and number of hits and misses.
-
Web Services
Data counters for this category contain information for the Web services. Examples include number of loaded Web services, number of requests delivered and processed, request response time, and average size of requests.
6.1.2 Performance data classification
The Performance Monitoring Infrastructure provides server-side data collection and client-side API to retrieve performance data. Performance data has two components: Static and dynamic.
The static component consists of a name, ID and other descriptive attributes to identify the data. The dynamic component contains information that changes over time, such as the current value of a counter and the time stamp associated with that value.
The PMI data can be one of the following statistical types defined in the JSR-077 specification (Figure 6-3 on page 177):
-
CountStatistic
-
BoundaryStatistic
-
RangeStatistic
-
TimeStatistic
-
BoundedRangeStatistic
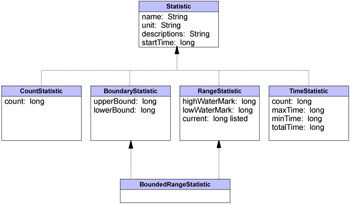
Figure 6-3: Statistic data types
RangeStatistic data contains the current value, as well as lowWaterMark and highWaterMark.
In general, CountStatistic data require a low monitoring level and TimeStatistic data require a medium monitoring level. RangeStatistic and BoundedRangeStatistic require a high monitoring level.
There are a few counters that are exceptions to this rule. The average method response time, the total method calls, and active methods counters require a high monitoring level. The Java Virtual Machine Profiler Interface (JVMPI) counters, SerializableSessObjSize, and data tracked for each individual method (method level data) require a maximum monitoring level.
In previous versions, PMI data was classified with the following types:
-
Numeric
Maps to CountStatistic in the JSR-077 specification. Holds a single numeric value that can either be a long or a double. This data type is used to keep track of simple numeric data, such as counts.
-
Stat
Holds statistical data on a sample space, including the number of elements in the sample set, their sum, and sum of squares. You can obtain the mean, variance, and standard deviation of the mean from this data.
-
Load
Maps to the RangeStatistic or BoundedRangeStatistic, based on the JSR-077 specification. This data type keeps track of a level as a function of time, including the current level, the time that level was reached, and the integral of that level over time. From this data, you can obtain the time-weighted average of that level. For example, this data type is used in the number of active threads and the number of waiters in a queue.
These PMI data types continue to be supported through the PMI API. Statistical data types are supported through both the PMI API and Java Management Extension (JMX) API.
The TimeStatistic type keeps tracking many counter samples and then returns the total, count, and average of the samples. An example of this is an average method response time. Given the nature of this statistic type, it is also used to track non-time related counters, like average read and write size. You can always call the getUnit method on the data configuration information to learn the unit for the counter.
In order to reduce the monitoring overhead, numeric and stat data are not synchronized. Since these data track the total and average, the extra accuracy is generally not worth the performance cost. Load data is very sensitive; therefore, load counters are always synchronized. In addition, when the monitoring level of a module is set to max, all numeric data are also synchronized to guarantee accurate values.
6.1.3 Enabling PMI service
In order to monitor a resource with Tivoli Performance Viewer or any PMI or JMX client, the PMI service of the application server associated with that resource has to be enabled. The PMI service can be enabled from the Performance Monitoring Service configuration pane in the Administrative Console or by using the wsadmin command interface.
Enabling PMI service using the administrative console
In order to enable the PMI service from the Administrative Console, open the Performance Monitoring Service properties configuration pane by using the following steps.
In the application server:
-
Expand the Servers folder from the navigation tree.
-
Click Application Servers from the Servers folder.
-
Click the name of your application server (for example, server1) from the list of application servers in the workspace.
-
Click the Performance Monitoring Service entry in the Additional Properties pane of the workspace. The Performance Monitoring Service properties configuration pane opens in the workspace.
-
To enable the PMI service of this application server, select the Startup check box.
In the node agent:
-
Open the administrative console.
-
Click System Administration -> NodeAgents in the console navigation tree.
-
Click node_agent.
-
Click Performance Monitoring Service.
-
Select the check box Startup.
-
(Optional) Select the PMI modules and levels to set the initial specification level field.
-
Click Apply or OK.
-
Click Save.
-
Restart the NodeAgent.
The changes you make will not take affect until you restart the NodeAgent.
Enabling PMI service through wsadmin
In order to configure the PMI service of a specific application server, a reference to the PMI service configuration object of that application server is needed. All PMI service configuration objects can be listed using the wsadmin list PMIService command (see Example 6-1).
Example 6-1: List PMI service configuration objects
C:\WebSphere\AppServer\bin>wsadmin WASX7209I: Connected to process "dmgr" on node net1Manager using SOAP connector; The type of process is: DeploymentManager WASX7029I: For help, enter: "$Help help" wsadmin>$AdminConfig list PMIService (cells/net1Network/nodes/node1/servers/CSVR1:server.xml#PMIService_1) (cells/net1Network/nodes/node1/servers/CSVR2:server.xml#PMIService_1) (cells/net1Network/nodes/node1/servers/nodeagent:server.xml#PMIService_1) (cells/net1Network/nodes/node1/servers/server1:server.xml#PMIService_1) (cells/net1Network/nodes/net1Manager/servers/dmgr:server.xml#PMIService_1) wsadmin>
Each line of output contains the PMIService configuration ID that can be used for referencing the PMIService component of a specific application server.
To enable performance data monitoring, use the following wsadmin modify command with your specific PMI service configuration ID:
wsadmin> $AdminConfig modify \ (cells/net1Network/nodes/node1/servers/server1: \ server.xml#PMIService_1) {{enable true}} The configuration needs to be saved before restarting the application server. Use the wsadmin save command to save the configuration:
wsadmin> $AdminConfig save
To restart the application server, use these wsadmin commands (in a single-server environment, do not specify the node in the startServer command):
wsadmin> $AdminControl stopServer server1 wsadmin> $AdminControl startServer {server1} {net1} To disable performance data collection, use the following wsadmin modify command (save the configuration and restart the application server for the change to take effect):
wsadmin> $AdminConfig modify \ (cells/net1Network/nodes/node1/servers/server1: \ server.xml#PMIService_1) {{enable false}} |
| < Day Day Up > |
|
EAN: N/A
Pages: 90