Using Reporting ServicesWithout the Report Manager
Using Reporting Services
Without the Report Manager
The Report Manager provides a nice interface for finding and executing reports but, sometimes, the Report Manager is not the best way to deliver a report to your users. Perhaps the user is browsing your website or using a custom application, and needs to view a report. In these situations, we want to provide an integrated approach with reporting available within the application. We want to deliver the report to the user right where they are.
URL Access
One way to execute a report without using Report Manager is through URL access. URL access allows a browser or a program capable of issuing HTTP requests to specify a URL and receive a report in the HTML report viewer. This URL can be built into a standard HTML anchor tag to allow a report to be displayed with one mouse click.
Basic URL Access
The basic URL used to access a report has two parts. The first part is the URL of the Report Server web service. In a default installation, this is
http://ComputerName/ReportServer
where ComputerName is the name of the computer hosting the Report Server. This is followed by a question mark and the path through the Reporting Services virtual folders to the report you want to execute. The Home folder is the root of this path, but it's not included in the path itself. The path must begin with a forward slash (/).
Let's try an example. We can execute the Inventory Levels By Month Report. This report is in the BIStudioDeploy folder inside of the MaxMinReports folder.
| Note | In the examples used throughout the rest of this chapter, we assume Reporting Services is installed on your computer. The localhost name is used to access Internet Information Services (IIS) information on this computer. If you have Reporting Services installed on a different computer, substitute the name of that computer in place of localhost in the following examples. |
-
Start Internet Explorer.
-
Enter the following URL in the address bar:
http://localhost/ReportServer?/MaxMinReports/BIStudioDeploy/ Inventory Levels By Month Report
-
Click Go. The Inventory Levels By Month Report appears in the browser as shown in Figure 16-5. Note the parameters area and the report toolbar in the browser above the report.
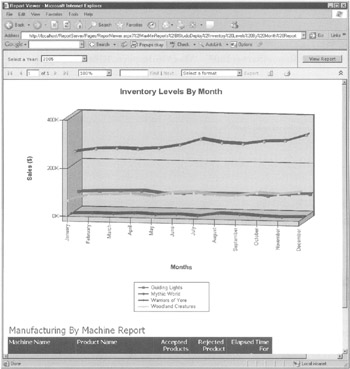
Figure 16-5: A URL-rendered report
| Note | When your URL is submitted, it is URL encoded. Some of the characters in your URL may be replaced by other characters or by hexadecimal strings, such as %20. This ensures the URL can be interpreted correctly when it is sent to the web server. |
As with the Report Manager, Windows Integrated Security is being used when a user executes a report through URL access. The user must have rights to execute the report; otherwise, an error results. However, because the user is not browsing through the folder structure to get to the report, the user does not need to have any rights to the folder containing the report. You can use this fact to hide a report from nonadministrative users who are browsing through folders in the Report Manager, while still making the report accessible to someone using URL access.
In addition to executing reports, you can also view the contents of folders, resources, and shared data sources. Try the following:
-
Enter this URL in the address bar:
http://localhost/ReportServer?/MaxMinReports
-
Click Go. The contents of the MaxMinReports folder appears.
-
Click the link for the BIStudioDeploy folder. The contents of the BIStudioDeploy folder appear, as shown in Figure 16-6.
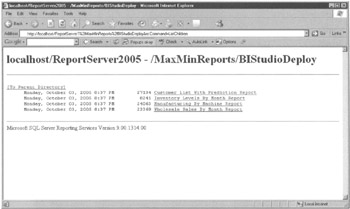
Figure 16-6: Browsing folder contents using URL access
Command Parameters
Look at the URL in the address bar. You see something has been added to the URL, namely &rs:Command=ListChildren. This is called a command parameter and it tells Reporting Services what to do with the item pointed to by the URL. The four possible values for the command parameter are listed in Table 16-1.
| Command Parameter | Applies To | Result |
|---|---|---|
| GetDataSourceContents | Data Source | Displays the data source definition as an XML structure. |
| GetResourceContents | Resource Item | Displays the contents of the resource item in the browser. |
| ListChildren | Folder | Lists the contents of the folder with links to each content item. |
| Render | Report | Displays the report in the Report Viewer. |
Looking at this table, you quickly realize that only one command parameter value applies to each type of item you can encounter in the Reporting Services virtual folders. Attempting to use a command parameter with the wrong type of item results in an error. If you do not include the command parameter, Reporting Services simply performs the one and only command that applies to the type of item you are targeting in your URL. Because specifying the command parameter is completely unnecessary, we can only assume this was put in place to allow for future growth.
Passing Parameters
When you executed the Inventory Levels By Month Report through URL access, you received the default value for the Year report parameter. You can change the year in the Report Viewer, but only after waiting for the report to execute with the default value. It would be much better to get exactly what you want the first time around.
Fortunately, you have a way to do just that. You can pass the values for report parameters as part of the URL. On the URL, include an ampersand (&) followed by the name of the report parameter, an equals sign, and the parameter value.
Try the following:
-
Enter the following URL in the address bar:
http://localhost/ReportServer?/MaxMinReports/BIStudioDeploy/ Inventory Levels By Month Report&Year=2004
-
Click Go. The Inventory Levels By Month Report appears with data for 2004 as shown in Figure 16-7.
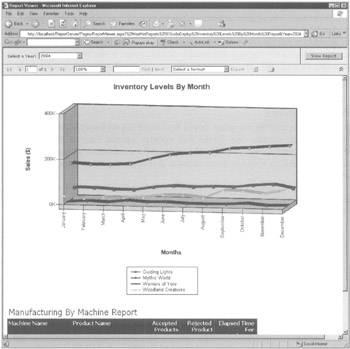
Figure 16-7: A report parameter passed in the URL
Hiding parameters from interactive report users is possible, while still allowing values to be passed to those parameters through the URL or web service access. This is done through the Hide option for each parameter. Let's try the following:
-
Open the Report Manager and navigate to the /MaxMinReports/BIStudioDeploy folder.
-
Click Show Details.
-
Click the icon in the Edit column next to the Manufacturing By Machine Report.
-
Click Parameters on the left side of the screen. The Parameter management page appears.
-
Check the Has Default check box for the Year parameter.
-
Enter 2005 as the Default Value for the Year parameter.
-
Check the Hide check box for the Year parameter. The Parameter management page appears as shown in Figure 16-8.
-
Click Apply.
-
Select the View tab. Notice the Year prompt no longer appears in the parameter area. In fact, because this was the only parameter for the report, the entire parameter area is gone, as shown in Figure 16-9. The data for 2005 appears.
-
Enter the following URL in the address bar:
http://localhost/ReportServer?/MaxMinReports/BIStudioDeploy/ Manufacturing By Machine Report&Year=2003
-
Click Go. The Manufacturing By Machine Report appears with data for 2003.
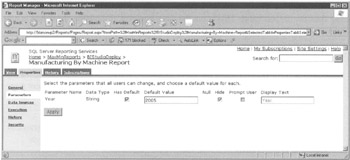
Figure 16-8: The Parameter management page with a hidden parameter
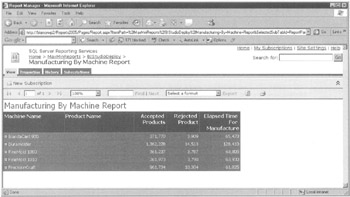
Figure 16-9: The report without a parameter area
Even though the Year parameter does not appear, we can still specify a value for it other than the default value. This is not the case, however, if the Hide check box is not checked. Give this a try:
-
Return to the BIStudioDeploy folder, so you are viewing the folder contents.
-
Click the icon in the Edit column next to the Manufacturing By Machine Report.
-
Click Parameters on the left side of the screen. The Parameter management page appears.
-
Uncheck the Hide check box for the Year parameter.
-
Uncheck the Prompt User check box for the Year parameter. The Year parameter is now a read-only parameter. The Parameter management page appears as shown in Figure 16-10.
-
Click Apply.
-
Enter the same URL as before in the address bar:
http://localhost/ReportServer?/MaxMinReports/BIStudioDeploy/ Manufacturing By Machine Report&Year=2003
-
Click Go. You receive an error stating, "The report parameter 'Year' is read-only and cannot be modified."
-
Enter the same URL without the value for the Year parameter:
http://localhost/ReportServer?/MaxMinReports/BIStudioDeploy/ Manufacturing By Machine Report
-
Click Go. The Manufacturing By Machine Report appears with data for 2005, the default value.
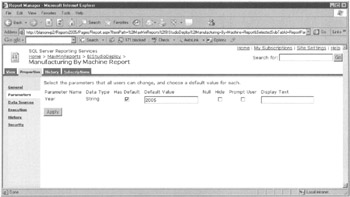
Figure 16-10: The Parameter management page with a read-only parameter
When Hide is checked for a report parameter, we can pass a value for the parameter, even though it is not displayed at the top of the report. When both Hide and Prompt User are unchecked, we cannot pass a value for the parameter. The default value must be used.
Let's return the parameter back to its default setting:
-
Return to the BIStudioDeploy folder, so you are viewing the folder contents.
-
Click the icon in the Edit column next to the Manufacturing By Machine Report.
-
Click Parameters on the left side of the screen. The Parameter management page appears.
-
Check the Prompt User check box for the Year parameter.
-
Click Apply.
Controlling the Report Viewer
In addition to specifying report parameters in the URL, you can also include parameters to control the format of the response from Reporting Services. You can specify which rendering format should be used for the report. Rather than using the Export drop-down list in the Report Viewer to export the report to a particular format, you can have it delivered in that format straight from Reporting Services. Give this a try:
-
Enter the following URL in the address bar:
http://localhost/ReportServer?/MaxMinReports/BIStudioDeploy/ Manufacturing By Machine Report&rs:Format=PDF
-
Click Go.
-
If you are prompted whether to open or save the file, click Open.
-
The Manufacturing By Machine Report appears in PDF format in Adobe Acrobat Reader.
Note If the report fails to open as a PDF, save the file to your hard drive first, and then open the newly created PDF file.
-
Close Adobe Acrobat Reader. The valid format parameters are as follows:
-
CSV
-
EXCEL
-
HTML3.2
-
HTML4.0
-
HTMLOWC
-
IMAGE
-
MHTML
-
NULL
-
PDF
-
XML
-
In addition to the rs:Command and rs:Format parameters, several other Report Server parameters use the rs: prefix. Table 16-2 shows these.
| Parameter | Valid Values | Function |
|---|---|---|
| rs:ClearSession | True False | When true, this parameter prevents a report from being pinned in cache by forcing the report to be rerendered. |
| rs:ParameterLanguage | a valid culture identifier, such as en-us | Used to specify a language for the parameters passed in the URL that is different from the browser's language setting. This defaults to the browser's language setting when it is not specified. |
| rs:SessionID | a unique session identifier | Used to maintain session state when the Report Server has been configured not to use session cookies. |
| rs:Snapshot | the data and time of a valid snapshot for the specified report | Used to render the requested report from a history snapshot. |
Device information parameters can also be passed as part of the URL. These device information parameters are specific to the format being used to render the report. Because they are rendering format-specific, device information parameters can also be thought of as renderer control parameters. Therefore, they use an rc: prefix.
Let's look at a couple of examples using device information parameters. When you receive a report rendered as HTML, you also receive the Report Viewer controls. This may not always be desirable. Several device information parameters enable you to specify what portion of the Report Viewer interface you want visible. For example:
-
Enter the following URL in the address bar:
http://localhost/ReportServer?/MaxMinReports/BIStudioDeploy/ Manufacturing By Machine Report&rc:Parameters=false
-
Click Go. The Manufacturing By Machine Report appears. The parameter portion of the Report Viewer is invisible, as shown in Figure 16-11, so the user cannot change the parameter values.
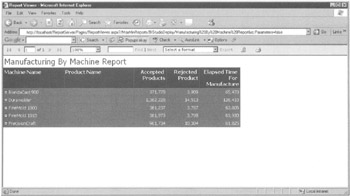
Figure 16-11: The parameters are suppressed.
You can get rid of the entire Report Viewer interface as follows:
-
Enter the following URL in the address bar:
http://localhost/ReportServer?/MaxMinReports/BIStudioDeploy/ Manufacturing By Machine Report&rc:Toolbar=false
-
Click Go. The Manufacturing By Machine Report appears.
-
Expand the Duramolder group. The report is shown in Figure 16-12.
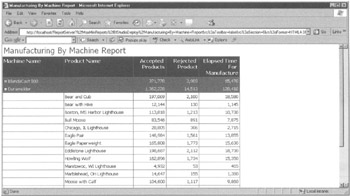
Figure 16-12: The suppressed toolbar
Even when we expand the group, causing a new page to be sent from the Report Server, the toolbar does not reappear.
Table 16-3 shows the device information parameters for the CSV format.
| Setting | Valid Values | Function |
|---|---|---|
| rc:Encoding | ASCII UTF-7 UTF-8 Unicode | The character-encoding scheme to use. The default is Unicode. |
| rc:Extension | The file extension for the file. The default is .CSV. | |
| rc:FieldDelimiter | The field delimiter to use in the file. The default is a comma. | |
| rc:NoHeader | True False | If true, no header is written with the data in the file. The default is false. |
| rc:Qualifier | The string qualifier to put around fields that contain the field delimiter. The default is a quotation mark. | |
| rc:RecordDelimiter | The record delimiter to use in the file. The default is a carriage return and linefeed. | |
| rc:SupressLineBreaks | True False | If true, line breaks in the data are not included in the file. The default is false. |
Table 16-4 shows the device information parameters for the Excel format.
| Setting | Valid Values | Function |
|---|---|---|
| rc:OmitDocumentMap | True False | If true, the document map for the rendered report is not included in the Excel file. The default is false. |
| rc:OmitFormulas | True False | If true, formulas are not included in the Excel file. The default is false. |
| rc:RemoveSpace | An integer or decimal followed by in (the abbreviation for inches) | When this parameter is included, rows and columns that do not contain data and are smaller than the size specified are not included in the Excel file. This parameter is used to exclude extra rows or columns that do not contain report items. The default is 0.125in. |
| rc:SimplePageHeader | True False | If true, the report page header is placed in the Excel page header. Otherwise, the report page header is placed in the first row of the worksheet. The default value is false. |
The device information parameters for the HTML formats are shown in Table 16-5.
| Setting | Valid Values | Function |
|---|---|---|
| rc:BookmorkID | {BookmarkID} | Jumps to the specified Bookmark ID in the report. |
| rc:DocMap | True False | Specifies whether the document map is shown. |
| rc:DocMapID | {DocMapID} | Jumps to the specified Document Map ID. |
| rc:EndFind | {PageNumber} | The last report page to be searched when executing a Find from the URL (see FindString). |
| rc:FallbackPage | {PageNumber} | The report page to go to if the Find is unsuccessful or a jump to a Document Map ID fails. |
| rc:FindString | {TextToFind} | Searches for this text in the report and jumps to its first location. |
| rc:HTMLFragment | True False | When this is set to true, the report is returned as a table rather than a complete HTML page. This table can then be placed inside your own HTML page. The default value is false. |
| rc:JavaScript | True False | If true, JavaScript is supported in the rendered report. |
| rc:LinkTarget | {TargetWindowName} _blank _self _parent _top | Specifies the target window to use for any links in the report. |
| rc:Parameters | True False | Specifies whether to show the parameters section of the Report Viewer. |
| rc: Replacement Root | The path used to prefix any hyperlinks created in the report. | |
| rc:Section | {PageNumber} | The page number of the report to render. |
| rc:StartFind | {PageNumber} | The first report page to be searched when executing a Find from the URL (see FindString). |
| rc:StreamRoot | {URL} | The path used to prefix the value of the src attribute of any IMG tags in an HTML rendering of the report. |
| rc:StyleSheet | The name of a cascading style sheet in the Report Server Styles folder to be applied to the Report Viewer. The name should not include the css extension. The default location of the Styles folder is C:\Program Files\MicrosoftSQLServer\MSSQL.3\Reporting Services\ReportServer\Styles. The default value is HTMLViewer. | |
| rc:StyleStream | True False | If true, styles and scripts are created as separate streams, rather than in the document. The default is false. |
| rc:Toolbar | True False | Specifies whether the Report Viewer toolbar is visible. |
| rc:Type | The shortname of the browser type, as defined in browsercap.ini. | |
| rc:Zoom | Page Width Whole Page 500 200 150 100 75 50 25 10 | The zoom percentage to use when displaying the report. |
Table 16-6 shows the device information parameters for the image format.
| Setting | Valid Values | Function |
|---|---|---|
| rc:ColorDepth | 1 4 8 24 32 | The color depth of the image created. The default is 24. This is only valid for the TIFF image type. |
| rc:Columns | The number of columns to use when creating the image. | |
| rc:ColumnSpacing | The column spacing to use when creating the image. | |
| rc:DpiX | The number of dots per inch in the x-direction. The default is 96. | |
| rc:DpiY | The number of dots per inch in the y-direction. The default is 96. | |
| rc:EndPage | The last page to render. The default value is the value for the StartPage parameter. | |
| rc:MarginBottom | An integer or decimal followed by in (the abbreviation for inches) | The bottom margin to use when creating the image. |
| rc:MarginLeft | An integer or decimal followed by in (the abbreviation for inches) | The left margin to use when creating the image. |
| rc:MarginRight | An integer or decimal followed by in (the abbreviation for inches) | The right margin to use when creating the image. |
| rc:MarginTop | An integer or decimal followed by in (the abbreviation for inches) | The top margin to use when creating the image. |
| rc:OutputFormat | BMP EMF GIF JPEG PNG TIFF | The graphics format to use. |
| rc:PageHeight | An integer or decimal followed by in (the abbreviation for inches) | The page height to use when creating the image. |
| rc:PageWidth | An integer or decimal followed by in (the abbreviation for inches) | The page width to use when creating the image. |
| rc:StartPage | The first page to render. A value of 0 causes all pages to be rendered. The default value is 1. |
Table 16-7 shows the device information parameters for the MHTML format.
| Setting | Valid Values | Function |
|---|---|---|
| rc:JavaScript | True False | If true, JavaScript is supported in the rendered report. |
| rc:MHTMLFragment | True False | When this is set to true, the report is returned as a table, rather than a complete HTML page. This table can then be placed inside your own HTML page. The default value is false. |
The PDF format device information parameters are shown in Table 16-8.
| Setting | Valid Values | Function |
|---|---|---|
| rc:Columns | The number of columns to use when creating the PDF file. | |
| rc:ColumnSpacing | The column spacing to use when creating the PDF file. | |
| rc:DpiX | The number of dots per inch in the x-direction. The default is 300. | |
| rc:DpiY | The number of dots per inch in the y-direction. The default is 300. | |
| rc:EndPage | The last page to render. The default value is the value for the StartPage parameter. | |
| rc:MarginBottom | An integer or decimal followed by in (the abbreviation for inches) | The bottom margin to use when creating the PDF file. |
| rc:MarginLeft | An integer or decimal followed by in (the abbreviation for inches) | The left margin to use when creating the PDF file. |
| rc:MarginRight | An integer or decimal followed by in (the abbreviation for inches) | The right margin to use when creating the PDF file. |
| rc:MarginTop | An integer or decimal followed by in (the abbreviation for inches) | The top margin to use when creating the PDF file. |
| rc:PageHeight | An integer or decimal followed by in (the abbreviation for inches) | The page height to use when creating the PDF file. |
| rc:PageWidth | An integer or decimal followed by in (the abbreviation for inches) | The page width to use when creating the PDF file. |
| rc:StartPage | The first page to render. A value of 0 causes all pages to be rendered. The default value is 1. |
Table 16-9 shows the device information parameters for the XML format.
| Setting | Valid Values | Function |
|---|---|---|
| rc:Encoding | ASCII UTF-8 Unicode | The character-encoding scheme to use. The default is UTF-8. |
| rc:File Extension | The file extension for the XML file. The default is .XML. | |
| rc:Indented | True False | If true, the XML file is indented. The default is false. |
| rc:MIMEType | The MIME type of the XML file. | |
| rc:OmitSchema | True False | If true, the schema name and XSD are not included in the XML file. The default is false. |
| rc:Schema | True False | If true, the XSL schema definition (XSD) is rendered in the XML file. Otherwise, the report itself is rendered in the XML file. The default is false. |
| UseFormattedValues | True False | If true, the formatted value of each text box is included in the XML file. Otherwise, the unformatted value of each text box is included. |
| XSLT | The path in the Report Server namespace of an XSLT document to apply to the XML file. The XSLT must be a published resource on the Report Server and it must be accessed through the Report Server itself. |
Finally, you can specify the user name and password for data sources that prompt for credentials each time the report is run. This is done using the dsu and dsp prefixes. For example, to specify credentials for a data source called MaxMin, you would add the following to the end of the URL:
dsu:MaxMin=MyDBUser&dsp:MaxMin=DBPassword
where MyDBUser is a valid database login and DBPassword is the password for that login.
URL Access Using an HTTP Post
The previous examples demonstrate the use of URL access using the HTTP Get method. This method has several limitations. First, all parameter values are exposed in the URL itself. Second, the number of characters you can have in a URL has a limit.
You can get around these limitations and still use URL access by employing the HTTP Post method. The HTTP Post method passes parameters as fields in an HTML form, so they are not exposed in the URL. Also, the HTTP Post is not subject to the same length restrictions as the HTTP Get.
The following HTML page uses the HTTP Post to request the Manufacturing By Machine Report for 2004 in the HTML 4.0, TIFF image, or Excel format:
<HTML> <Head> <title> Reporting Services URL Post Demo </title> </Head> <Body> <FORM action=" http://localhost/ReportServer? /MaxMinReports/BIStudioDeploy/Manufacturing By Machine Report" method="post" target="_self"> <H3>Manufacturing By Machine Report</H3><br> <b>For 2004</b><br><br> Render the Manufacturing By Machine Report in the following format:<br> <Select ID= "rs:Format" NAME="rs:Format" size=1> <Option Value= "HTML4.0">HTML 4.0</Option> <Option VALUE="IMAGE">TIFF Image</Option> <Option VALUE="EXCEL">Excel FIle</Option> </Select> <Input type="hidden" name="Year" value="2004"> <br><br> <INPUT type="submit" value="Render Report"> </FORM> </Body> </HTML>
The HTML form appears as shown in Figure 16-13.
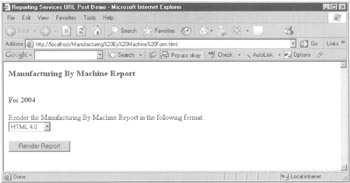
Figure 16-13: The HTML form for requesting a report using an HTTP method
Web Service Access
In addition to URL access, you can also access reports by using the web service interface. This is the same interface used by the Report Manager web-based application to interact with Reporting Services. This means anything you can do in Report Manager, you can also do through the web service interface.
The web service interface provides additional functionality unavailable through URL access. For example, the web service interface enables you to specify a set of credentials to use when executing a report. This allows your custom application to use a set of hard-coded credentials to access reports through the web service interface. This can be a big benefit in situations where you want Reporting Services reports to be exposed on an Internet or extranet site where each user does not have a domain account.
Using a Web Service Call to Execute a Report
This example takes you through the steps necessary to execute a report using the web service interface. In this example, you build a web application that acts as a front end for the Manufacturing By Machine Report.
Creating a Project and a Web Reference First, you need to create an ASP.NET project with a reference to the Reporting Services web service.
-
Start Visual Studio 2005. (This example also works in earlier versions of Visual Studio.NET.)
-
Create a new project.
-
Select Visual Basic Projects in the Project Types area.
-
Select ASP.NET Web Application from the Templates area.
-
Enter http://localhost/MaxMinFronlEnd for Location.
-
Click OK.
-
When the new project has been created, right-click the project folder for this new project in the Solution Explorer and select Add Web Reference from the Context menu. The Add Web Reference dialog box appears.
-
Select the link for Web Services on the Local Machine.
Note Again, if Reporting Services is not on your computer, do not use this link. Instead, look for the web service on the computer where Reporting Services is installed.
-
When the list of web services on the local machine appears, click the link for ReportExecution2005.
-
When the ReportExecution2005 description appears in the dialog box, click Add Reference.
To use a web service, you need to create code that knows how to send data to and retrieve data from that web service. Fortunately, this code is generated for you by Visual Studio through the process of creating a web reference. Once the web reference is in place, you can call the methods of the web service the same way you call the methods of a local .NET assembly.
When you clicked the link for Web Services on the Local Machine, a URL beginning with http://localhost was used to locate the web services on the local machine. Because of this, the Reporting Services web service uses localhost .ReportingService as its namespace.
Creating the Web Form Now, we need to create the web form to serve as our user interface.
-
Change the name of WebForm1.aspx to ReportFrontEnd.aspx.
-
Place two labels, one drop-down list, and a button on the web form, as shown in Figure 16-14.
-
Change the ID property of the drop-down list to 1stPicYear.
-
Populate the Items collection of the list with: 2003, 2004, 2004.
-
Change the ID property of the button to cmdExecute.
-
Change the Text property of the button to Display Report.
-
Double-click the cmdExecute button to open the code window.
-
Enter the following code for cmdExecute_Click.
Private Sub cmdExecute_Click(ByVal sender As System.Object, _ ByVal e As System.EventArgs) _ Handles cmdExecute.Click Dim report As Byte() = Nothing ' Create an instance of the Reporting Services ' Web Reference. Dim rs As localhost.ReportExecutionService _ = New localhost.ReportExecutionService ' Create the credentials that will be used when accessing ' Reporting Services. This must be a logon that has rights ' to the Manufacturing By Machine report. ' *** Replace "LoginName", "Password", and "Domain" with ' the appropriate values. *** rs.Credentials = New _ System.Net.NetworkCredential("LoginName", _ "Password", "Domain") rs.PreAuthenticate = True ' The Reporting Services virtual path to the report. Dim reportPath As String = _ "/MaxMinReports/BIStudioDeploy/Manufacturing By Machine Report" ' The rendering format for the report. Dim format As String = "HTML4.0" ' The devInfo string tells the report viewer ' how to display with the report. Dim devInfo As String = _ "<DeviceInfo>" + _ "<Toolbar>False</Toolbar>" + _ "<Parameters>False</Parameters>" + _ "<DocMap>True</DocMap>" + _ "<Zoom>100</Zoom>" + _ "</DeviceInfo>" ' Create an array of the values for the report parameters Dim parameters(0) As localhost.ParameterValue Dim paramValue As localhost.ParameterValue _ = New localhost.ParameterValue paramValue.Name = "Year" paramValue.Value = 1stPicYear.SelectedValue parameters(0) = paramValue ' Create variables for the remainder of the parameters Dim historyID As String = Nothing Dim credentials() As _ localhost.DataSourceCredentials = Nothing Dim showHideToggle As String = Nothing Dim encoding As String Dim mimeType As String Dim warnings() As localhost.Warning = Nothing Dim reportHistoryParameters() As _ localhost.ParameterValue = Nothing Dim streamIDs() As String = Nothing ' Prepare for report execution. Dim execInfo As New localhost.ExecutionInfo Dim execHeader As New localhost.ExecutionHeader rs.ExecutionHeaderValue = execHeader execInfo = rs.LoadReport(reportPath, historyID) rs.SetExecutionParameters(parameters, "en-us") Try ' Execute the report. report = rs.Render(format, devInfo, "", mimeType, _ "", warnings,streamIDs) ' Flush any pending response. Response.Clear() ' Set the HTTP headers for a PDF response. HttpContext.Current.Response.ClearHeaders() HttpContext.Current.Response.ClearContent() HttpContext.Current.Response.ContentType = "text/html" ' filename is the default filename displayed ' if the user does a save as. HttpContext.Current.Response.AppendHeader( _ "Content-Disposition", _ " filename=""ManufacturingByMachineReport.HTM" " ") ' Send the byte array containing the report ' as a binary response. HttpContext.Current.Response.BinaryWrite(report) HttpContext.Current.Response.End() Catch ex As Exception If ex.Message <> "Thread was being aborted." Then HttpContext.Current.Response.ClearHeaders() HttpContext.Current.Response.ClearContent() HttpContext.Current.Response.ContentType = _ "text/html" HttpContext.Current.Response.Write( _ "<HTML><BODY><H1>Error</H1><br><br>" & _ ex.Message & "</BODY></HTML>") HttpContext.Current.Response.End() End If End Try End Sub -
Click Save All in the toolbar.
-
Select Debug | Start from the Main menu. This executes your program.
-
When the browser window appears with the web application front-end page, click Display Report. The report appears using the dates selected on the front-end page.
-
Switch back to Visual Studio and select Debug I Stop Debugging from the Main menu.
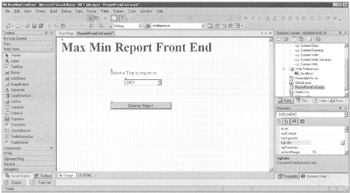
Figure 16-14: The Report Front End form
You can refer to the comments in the code sample for information on the purpose of each section of code.
| Note | The items in the DeviceInfo XML structure are the same rendering-specific, device information settings as those documented in the "URL Access" section of this chapter. Use the parameter name, minus the rc: prefix, as the element name. |
Managing Reporting Services through Web Services
In addition to executing reports through the web service interface, you can also manage Reporting Services using the web services. If you choose, you can write an application that completely replaces the Report Manager web application for controlling Reporting Services.
The Report Viewer Control
The Report Server web service gives you a tremendous amount of control over report access. However, the web service simply provides our applications with a stream that contains the report. It is up to our applications to provide an appropriate method for viewing the content of that report stream.
The Report Viewer control in Visual Studio 2005 takes things one step further. Not only does it provide access to the reports, but it also provides a means to view them. In fact, the Report Viewer can even free you from the tether to the Report Server altogether. The Report Viewer control can be used in both Windows forms and web forms.
Displaying a Report from a Report Server
We first use the Report Viewer control to access a report on the Report Server. In this example, you build a Windows application that uses the Report Viewer to display the Manufacturing By Machine Report. For this application to function properly, it must have access to the Report Server whenever a report is executed.
| Note | The web service example in the previous section works in any version of Visual Studio.NET. The Report Viewer examples in this section require Visual Studio 2005. |
Creating a Project and an Instance of the Report Viewer First, you need to create a Windows application project in Visual Studio 2005.
-
Start up Visual Studio 2005.
-
Create a new project.
-
Select Visual Basic | Windows in the Project Types area.
-
Select Windows Application from the Templates area.
-
Enter MaxMinRVFrontEnd for Name. Select an appropriate Location for this project.
-
Click OK. A Windows application project with a Windows form, called Form1, is created.
-
Expand Form1, so it adequately displays the report.
-
Select the Toolbox window.
-
Locate the Data section of the Toolbox and, if it is not already expanded, expand it.
-
Drag the Report Viewer control from the Toolbox and drop it on Form1. See Figure 16-15.
-
Click the Dock in Parent Container link in the ReportViewer Tasks dialog box.
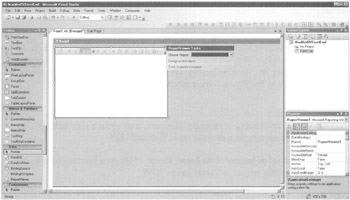
Figure 16-15: Placing a Report Viewer control on a Windows form
| Note | If you plan to put other controls on the same form with the Report Viewer, do not dock the viewer in the parent container. |
Configuring the Report Viewer Now we need to point the Report Viewer at a report. We need to make several selections from the ReportViewer Tasks dialog box. If this dialog box is invisible, click the small black triangle in the upper-right corner of the Report Viewer control as shown in Figure 16-16.
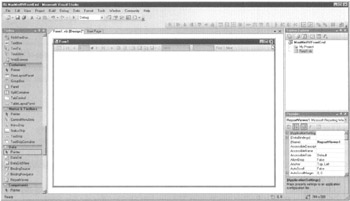
Figure 16-16: Opening the Reportviewer Tasks dialog box
-
In the ReportViewer Tasks dialog box, select <Server Report> from the Choose Report drop-down list.
-
Enter http://ServerName/ReportServer for Report Server URL where ServerName is the name of the server hosting Reporting Services.
-
Enter /MaxMinReports/BIStudioDeploy/Manufacturing By Machine Report for Report Path.
-
Click Save All in the toolbar.
-
Select Debug | Start Debugging from the Main menu. Form1 executes and displays the Manufacturing By Machine Report from the Report Server
-
Expand the Duramolder group. The interactive features, such as drilldown, work in the Report Viewer control as shown in Figure 16-17.
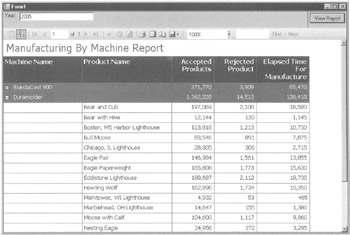
Figure 16-17: The Report Viewer displaying a report with drilldown
| Note | You can use the ServerReport:ReportServerUrl and ServerReport:ReportPath properties of the Report Viewer control to programmatically change the report that the Report Viewer displays. In this way, a single Report Viewer control can display different reports, depending on user selection. |
Displaying a Local Report in the Report Viewer
So far, all the methods of accessing reports we looked at in this chapter have required a Report Server. The Report Server provides a number of advantages for managing reports, including centralized control for updating report definitions and maintaining security. However, in some situations, it is impractical or undesirable for all installations of an application to pull reports from a Report Server.
The Report Viewer control provides an alternative. In addition to displaying reports rendered by a Report Server, the Report Viewer can also render reports contained within the Visual Studio project. In this example, we create a simple report right in the Visual Studio project, and then display it with the Report Viewer.
Creating a Local Report We begin by creating a report in the Visual Studio project.
-
Close Form1 and return to Visual Studio 2005, if you have not already done so.
-
Open the ReportViewer Tasks dialog box.
-
Click the Design a New Report link. A new item, called Report1 .rdlc, is created in the project as shown in Figure 16-18.
-
As with reports created previously, the first step in designing a local report is to define the data source. Click the Add New Data Source link in the Data Sources window. The Data Source Configuration Wizard dialog box appears as shown in Figure 16-19.
-
As you can see in the dialog box in Figure 16-19, we can use information from a database, from a web service, or from an object in our application as a data source for the report. Make sure Database is selected and click Next. The Choose Your Data Connection page of the wizard appears as shown in Figure 16-20.
-
Click New Connection. The Add Connection dialog box appears.
-
Create a connection to the MaxMinManufacturingDM database. Set the appropriate authentication. Test the connection to make sure you configured it correctly. When the connection passes the test, click OK.
-
The wizard may warn you that sensitive information, namely the password, is being included in the connection string. Select the radio button next to "Yes, include sensitive data in the connection string" and click Next. The Save the Connection String to the Application Configuration File page of the wizard appears as shown in Figure 16-21.
-
In most cases, it makes sense to store the connection information in the configuration file to make maintenance easier. Leave the default setting of Yes and click Next. The Choose Your Database Objects page appears.
-
Expand the tables node and place a check next to DimProduct. Enter ProductList for the DataSet Name. The Choose Your Database Objects page of the wizard appears as shown in Figure 16-22.
-
Click Finish to complete the wizard. A typed dataset is created by the wizard for use with the report. The ProductList data source appears in the Data Sources window as shown in Figure 16-23.
-
Select the Toolbox window and place a text box at the top of the report layout area. This text box is the title of the report. Enter Product List as the content of the text box and format it appropriately for a report title.
-
Add a table to the report layout.
-
Select the Data Sources window. Expand the ProductList | DimProduct entry to see the fields in the dataset. Drag the fields into the detail line of the table. Format the column headings appropriately.
-
Your report layout should appear similar to the layout shown in Figure 16-24.
-
Click Save All in the toolbar.
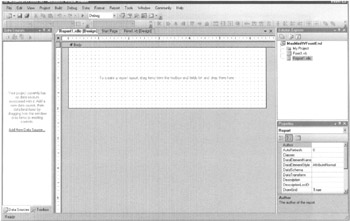
Figure 16-18: Creating a new report
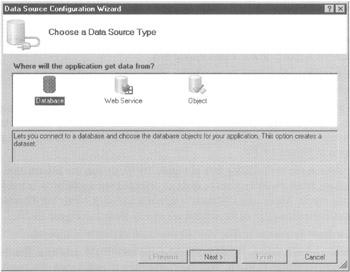
Figure 16-19: The Choose a Data Source Type page of the Data Source Configuration Wizard
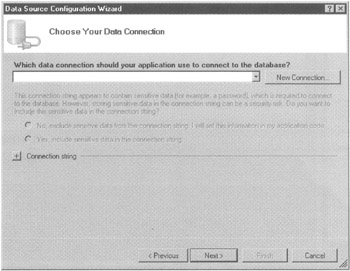
Figure 16-20: The Choose Your Data Connection page of the Data Source Configuration Wizard
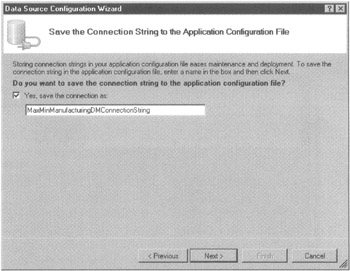
Figure 16-21: The Save the Connection String to the Application Configuration File page of the Data Source Configuration Wizard
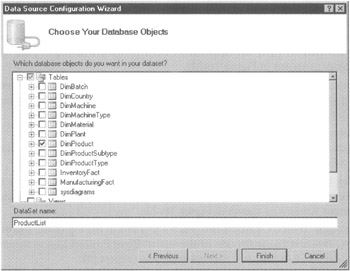
Figure 16-22: The Choose Your Database Objects page of the Data Source Configuration Wizard
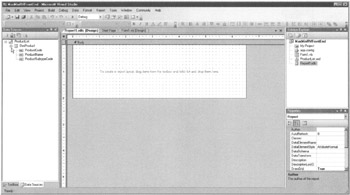
Figure 16-23: The ProductList Data Source in the Data Sources window
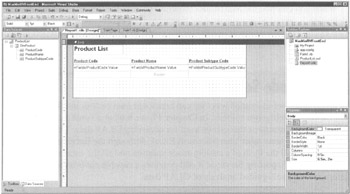
Figure 16-24: Layout of the local report
Point the Report Viewer at the Local Report Now, we point the Report Viewer at the new local report.
-
Click the Form1.vb [Design] tab in the layout area of Visual Studio 2005.
-
Open the ReportViewer Tasks dialog box.
-
Select MaxMinRVFrontEnd.Report1.rdlc from the Choose Report drop-down list.
-
Click Save All in the toolbar.
-
Select Debug | Start Debugging from the Main menu. Form1 executes and displays the local report. The local report you just created displays a list of all Max Min products as shown in Figure 16-25.
-
Close Form1 when you finish viewing this report.
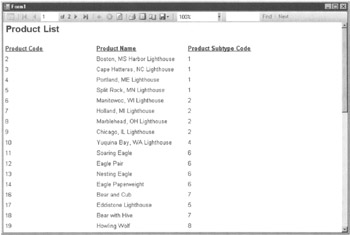
Figure 16-25: The Product List local report
When you compile the MaxMinRVFrontEnd project, the Report1.rdlc report definition is complied as an embedded resource in the executable. Therefore, nothing else except the data source is needed for the report to be rendered. The report always goes along with the application.
EAN: 2147483647
Pages: 112