Section 6.7. Views
6.7. ViewsViews, as represented by the view buttons, are collections of database queries that share a common theme. Each individual query in a view group extracts the same type of information from the operations database, but all views are all a variation on that theme. For example, alert view queries (also called view objects) all return alert data, but while one does so for alerts related to Active Directory, another does so for Exchange- or MOM-related alerts, and so on. You see these variations in the upper portion of the navigation panel. To understand how a view query works, open its properties field. An individual view query is made up of a name, optional description, the data type being queried, and the parameters the query is using to filter. A good example of a simple view query is the All Alerts Query. Figure 6-14 shows the properties of the All Alerts View - Alerts query. Figure 6-14. The properties of the All Alerts View - Alerts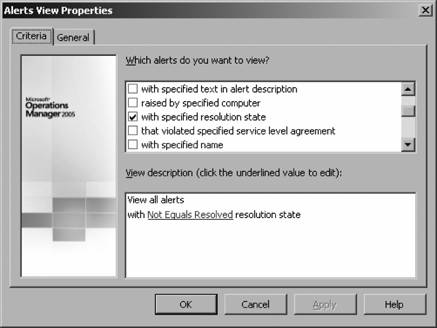 This alert query is looking for alerts with a specific value in the resolution state field. In this case, it is the Not Equals Resolved value. By clicking on the Not Equals Resolved text, you are taken to a dialog box where you specify the desired resolution state or states. All view queries follow this same pattern and range from the very simple (see Figure 6-14) to the very complex, which include conditional statements and time ranges. Every view query in the Operator console is editable, but it is not recommended that you modify the default queries. Instead, copy one of the existing view queries that is similar to the one that you want to create and paste it into the My Views group. Then open its properties and modify them to meet your needs. When you are getting started, this is a great way to learn the logic of the queries without the danger of affecting the default view queries that are being actively used. 6.7.1. Alerts view groupMOM initiates the interaction with the alerts view group , along with the state and diagram view groups. You, as a consumer of MOM information, can sit and watch the results pane for updates if you so choose. The types of alerts that you will see depend on the view query and the computer group from the scope console that is selected. Included in this view group are the Service Level Exception view queries. These are populated by regular alerts that have been in any of the given resolution states (except Resolved) for longer than the configured time (see the "Alert Resolution States" section in Chapter 5). This is the only view type in which you can manipulate field values as necessary in the process of investigating and resolving an individual alert. The life cycle of investigating and resolving an alert was covered in "The Life of a MOM 2005 Alert" section in Chapter 1. 6.7.2. State view groupAlerts are great for giving very specific information about one issue, usually on just one machine, and they are invaluable in the troubleshooting process. Because of their specificity, alerts can't give you a broad view of the overall health of your environment and they don't let you see the relationships between components, computers, and computer groups. This is what state views do. In a single glance, a state view will tell you the health of an individual computer or an entire computer group and its subgroups. It will tell you the health of each of the instances of a role on the computer (e.g., the C: drive is an instance of the disk role on a computer). Like all views, the state view data is frequently updated, once a minute by default. So, when your CIO walks into your cube and asks, "How is Exchange doing right now?" you can finally give an accurate answer. State view information is generated by event and performance rules that have the "Enable state alert properties" value selected. Not every rule has this value selected, so the vendor is telling you how important a state alert properties enabled rule is as a health indicator merely by enabling it. If a rule has this value enabled, it also tells you that any alerts it generates are worthy of a higher level of attention. When one of these rules fires an alert that will display in the alerts view, it also changes the state of the object that it is monitoring, which goes into the state calculation for the object instance, role, computer, and computer group. Rules that affect state calculations don't just change the state in a one-way fashion, such as from good to bad. Built into these types of rules is logic that changes the state from bad back to good when the appropriate criteria are satisfied. For example, there is a rule that monitors the DNS server service (dns.exe). It is located in the Microsoft Windows DNS Server MOM also initiates interaction in the state view; this is seen in the constant updating of the state values. Figure 6-15 shows the Microsoft Operations Manager view query of the MOM 2005 management server's computer group. The navigation pane and the tasks pane have been hidden for the sake of clarity. Figure 6-15. Microsoft Operations Manager state view of the MOM 2005 management servers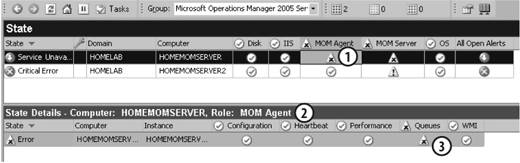 This state view query has returned the state of the roles for the two management servers, homemomserver and homemomserver2. In point 1 in Figure 6-15, MOM Agent's cell for homemomserver has been selected. It is showing an error state. Unlike the alert view where a whole row is used to show a single alert and the details pane changes as you shift the focus between rows, in the state view an individual cell is used to show a state value and the contents of the details pane update as the focus shifts from cell to cell in the results pane. In Figure 6-15, the details pane is showing the state details for homemomserver, MOM agent role (point 2 in Figure 6-15). The state of the MOM Agent role is calculated using the state values from the configuration, heartbeat, performance, queues, and WMI components. Of these, it is the MOM Agent queues that are in an error state (point 3 in Figure 6-15), so troubleshooting efforts should be concentrated there. To find out more about what is causing this error state for the MOM agent queues on this box, select the queues error cell (point 3 in Figure 6-15) and right-click to bring up the context menu. You can view alerts, events, performance, and attribute information for this computer. Go to the alert view, which pinpoints the specific alert that the error indicated (Figure 6-16). From there, follow your regular process for troubleshooting the issue that caused the error alert. Once the issue is resolved, the state will automatically be set back to good. The alert is resolved, closing the troubleshooting loop. Figure 6-16. MOM 2005 management server error for Computer: homemomserver, Role: MOM Agent, Instance: homemomserver The events view would have shown all of the events for that computer in that computer group and would not have shown the alert that was affecting the health state. You probably would have found the specific event that caused the alert to be triggered, but you would have had to sift through all the events to find it. In other words, the event view creates too much noise. The performance view contains all the performance monitor values for that computer. Since this error state was for a full queue, I probably could have found the queue that was full (if it had a performance counter object) and troubleshot the issue, but that would not have been the shortest path to resolution. The view computer attributes choice would simply have displayed all of the attributes and their values that MOM collected for that computer. These are the same attributes (registry values and file versions) that are collected when the computer discovery process kicks off. These attributes sort computers into computer groups. For example, one of the attributes of homemomserver is Microsoft Windows IIS Web Server, which is used to detect if the W3SVC is installed. If this registry value (HKLM\System\CurrentControlSet\Services\W3SVC\Start) is set to 2 then this server is sorted into the IIS Web Servers computer group. This is good to know, but it would not have helped in troubleshooting the error state. 6.7.3. Diagram view groupThe diagram view is another way to present the state value of a computer group in the Operator console. Figure 6-17 shows a very simple state representation of the MOM 2005 management servers computer group and its member servers. This diagram was generated by selecting the diagram view group button and the All: Diagram Views - Diagram view query. The computer group selection out of the console scope was left at the Microsoft Operations Manager 2005 Servers value. Figure 6-17. Diagram view of the Management Servers computer group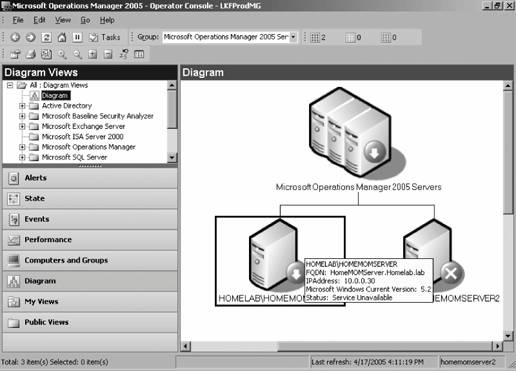 As in the state view, the status indicator is updated dynamically and some details about an object will appear in a pop-up box when you hover the mouse over the object. This helps to make up for the lack of a details pane in diagram views. As with the other views, the context menu for each icon allows you to pivot on the selected object into other data type views. Getting a legible diagram based on your filter build can be a frustrating experience. This is because diagram views attempt to map out relationships between computers and computer groups, so even in a very simple environment, like the HOMELAB domain, this can yield an unusable drawing. For example, there are only five computers being monitored by this management group, which in the state view is easy to see and digest (Figure 6-18). Granted, this is only looking at the state for each machine and not at the computer group roll-up. Figure 6-18. The state view for all computers in the management group is clean and legible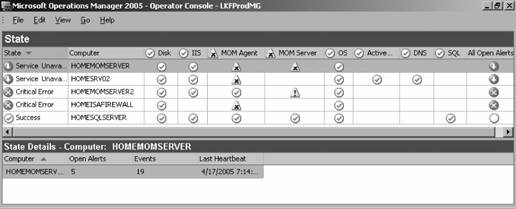 However, if you keep the same filter and switch to the diagram view, you get something that might be usable if printed out on a very large piece of paper from a plotter (Figure 6-19). Figure 6-19. The diagram view of all computers in the management group is not very usable for daily operations tasks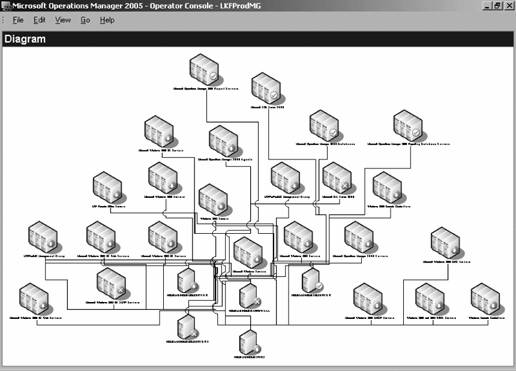 In this diagram, the icons that show three computers side by side represent computer groups; the individual machines are represented by single computer icons. As you can see, there are many more computer groups than individual machines. The complexity of this diagram is driven by individual machines belonging to multiple computer groups. Fortunately, you can export these diagrams to Visio for further manipulation and final rendering. The point is you'll have to work harder to get what you want out of a diagram view than any of the other views, so be patient. There are a few additional controls in the diagram view properties that you can manipulate. To access them, bring up the context menu in the diagram view and select Properties. The available properties are:
The diagram view sits at the top level in terms of summarizing the state of your environment, with alerts at the bottom, and state views in the middle. The renderings it gives will be the most useful to individuals that like to see things from the 50,000-foot view. 6.7.4. Computers and Groups view groupThe views in this group focus on some basic demographic statistics of computer groups and the details of the computers in those groups. At the computer group level, the rule tracks data such as the number of open alerts in the group, the types of alerts, and the number of subgroups and computers in the group. For each computer in the group, the rule tracks the number and types of alerts and in the details pane, tracks each computer's attributes, the rule groups applied, the computer groups it belongs to, and the details of each of the roles on that computer. The information in this rule group is used more for research than for tracking the current state or alerts for a computer or application. For example, Table 6-1 shows the data that is tracked by this view for the Windows 2000 Domain Controllers computer group.
You can export this information from the Operator console by selecting it and choosing "Copy formatted data" in the context menu. Table 6-2 contains the default fields and values that are tracked for an individual computer, in this case homesrv02.
In Table 6-2, the last three entries need a little explaining. Maintenance Mode End has a date and time value assigned by default. As soon as this server is placed into maintenance mode for the first time, this value would be overwritten. Because this server has never been in maintenance mode, the last two entries have no value assigned to them. One of the main uses you will have for this view is to get the details of the roles on any managed computer. For example, if you need to document the details for all instances of drives in the role of disks on the computer homesrv02, you would build a filter following the three-step method:
Much of the data in the details pane cannot be viewed, simply because there is so much. To work around this you can choose to select all the data in the Rules tab and copy it to an Excel spreadsheet for further use. 6.7.5. Events view group, performance view group , and public views groupThese three view groups fall firmly into the "Tell me what was happening on XYZ computer" category for interactions. They are aggregations of the collected event logs and performance monitor counters from managed computers. Figure 6-20. Disk detail information available in the Computers and Groups view group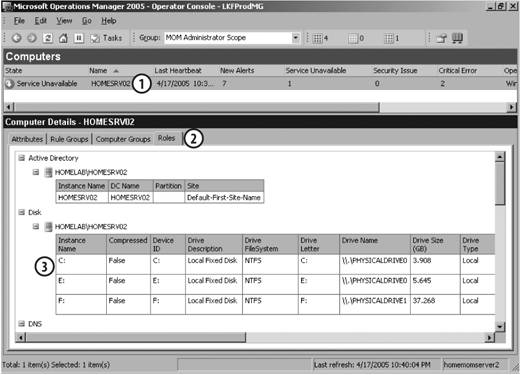 The task status events track the milestones for both system- and user-initiated tasks. For example, every day at 2:05 a.m. the computer discovery task kicks off and its success or failure is recorded in the event logs on the management servers and is also reported in the task's status events. The computer discovery task also tracks task status for user-initiated tasks, such as on-demand computer discovery scan tasks in the Tasks pane of the Operator console. For some tasks, and you have to determine this on a task-by-task basis, the output of the task only displays here. For example, in Figure 1-9, the ping task was run against homemomserver and the output was presented in a pop-up box. For other tasks, such as "Test end-to-end monitoring," you must go to the "all tasks view" to see the output. The performance monitor counter charting, while convenient, is no replacement for using the native performance monitor tool in the OS. With this view, you are limited to graphing the collected information. You do not have the ability to adjust the minimum/maximum values for the graph. The public views group gathers all of the predefined view queries together into one view group. 6.7.6. My Views groupAll the views and view queries other than the My Views group are available to all users of the console. And as many as there are, undoubtedly you will want to create ones that are tailored to a particular need at any given time. The My Views group is where you will customize existing views and create new ones from scratch. View queries that are created here are only available to you. To share a view query, it must be copied to any of the publicly viewable view groups. In the beginning of this chapter, the Leaky Faucet administrator, Max, created a custom computer group called LKF Remote Office Servers, where he placed the remote site servers and added the homesrv02 and homesqlserver servers. Now he needs to create custom views based on that and any other future Leaky Faucet-created computer groups. To make identifying Leaky Faucet-created computer groups easier, he will prepend the names with the LKF tag, just as he does with custom rules. Since Max is new to creating view queries, he will develop the folder and all queries in the My Views group. Once he is satisfied with the functionality, Max will move the queries to the Public Views group. The first views that Max wants to create are state and alert views. He starts by creating an All LKF Views folder in the My Views group. This is done via the context menu for the All My Views folder. Then, in the All LKF Views folder, via the context menu he selects "Create a new alerts view query." Next, he selects the type of alerts he wants to view (Figure 6-21). In this case, it is alerts that satisfy specified criteria, which leaves the filter open to all alerts. Figure 6-21. Create Alerts View wizard selection for alert types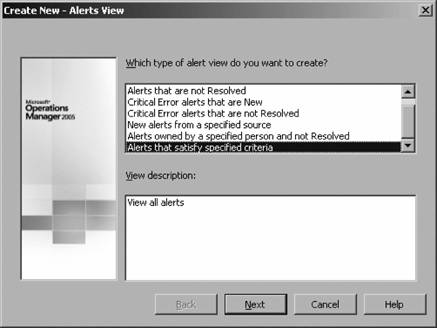 Moving to the next page, Max selects which alerts he wants included and enters the specified group text string. Note that you can use wildcard characters in the computer group name. This way, if Max creates any other computer groups for the remote offices, as long as he follows the naming convention, those groups will be included in the view (Figure 6-22). The wizard finishes by requiring a name and an optional description. Figure 6-22. Specifying the computer group to view alerts from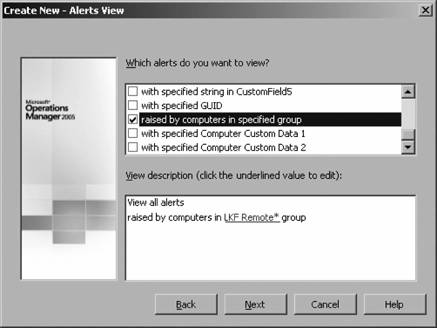 Max then repeats this process to create a state view, with one notable exception. After he specifies the LKF Remote* string for the computer group name, the wizard presents a page to select the roles he wants to include. The choices are to display all roles, including any roles that may be added in the future, or to pick specific roles. To minimize maintenance of the view, Max leaves the default, which is to include all roles (Figure 6-23). Figure 6-23. Selecting to include all current and future roles that may be monitored on these computers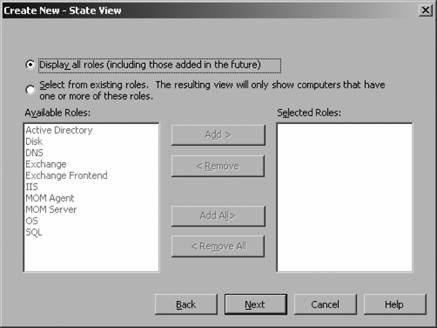 The wizard finishes and both view queries are immediately active. Unlike the Administrator console, where a configuration change like this would require a "commit configuration change" action, the Operator console does not. The whole console needs to be refreshed. This is done by either selecting View The last step to make these view queries available to the remote site administrators is to copy and paste them into the Public Views group. This step is necessary because these queries were developed in the My Views of an administrator, which is not accessible to anyone but that administrator. Figure 6-24 shows the final resultthe All LKF Views folder published with the State View selected (looks like the MOM Agent Queues error alert finally got cleared up). Figure 6-24. Publicly accessible custom view queries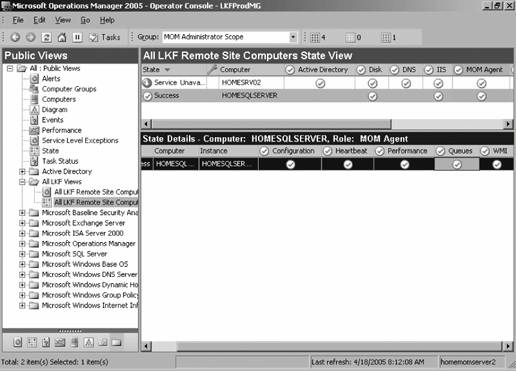 |
 Windows 2003 DNS
 EAN: 2147483647
Pages: 107