Section 6.8. Customizing the Operator Console
6.8. Customizing the Operator ConsoleThe basic four-pane arrangement (five counting the Tasks pane) needn't be a static one. You can configure additional Results panes, each displaying different information based on the view group and selections in the Navigation panes. Additionally, for views that can display data with a time component, say events or alerts that have occurred between certain times, you can configure different time windows. Additional Results panes and other settings are controlled from the File menu Figure 6-25. Configuring Operator console settings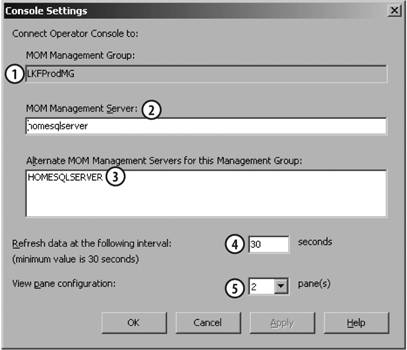
Figure 6-26. The Operator console with multiple view panes configured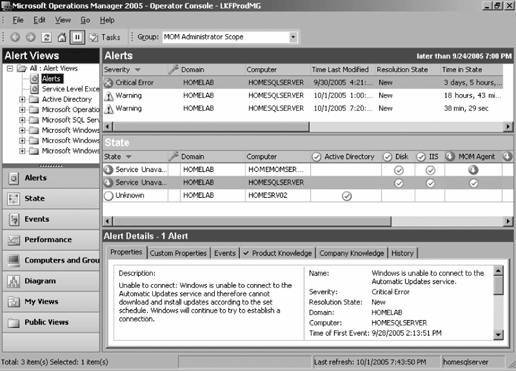 In Figure 6-26, one Results pane is displaying MOM operational data in an Alerts view and the other one is showing a State view. The details pane always shows the data of a specific item in the Results panes; in this case it is the Critical Error alert on homesqlserver. When you find a configuration that is particularly useful to you can save it as a file with an .omc extension (File menu To control the time frame of the displayed data, use the View Date and Time Filter toolbar button. If it is not displayed, select it from the View menu When you select this, the View Date and Time Filter page is displayed, as shown in Figure 6-29. This additional filter allows you to display data that occurred within a given period of time using the "Within the time range" options or simply within the last number of seconds, minutes, hours, or days using the "Within the last" options. Figure 6-27. Saving an Operator console configuration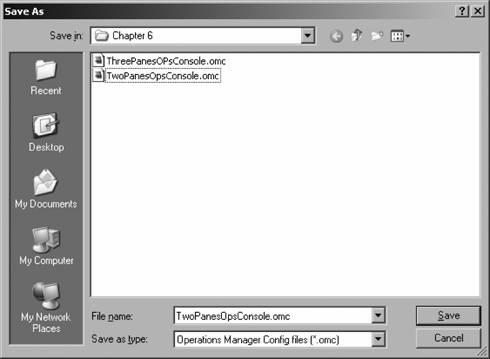 Figure 6-28. View Date and Time Filter toolbar button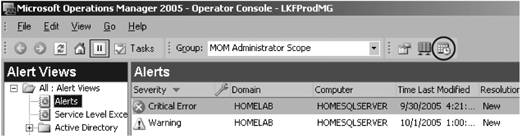 Figure 6-29. Setting the time filter for the Operator console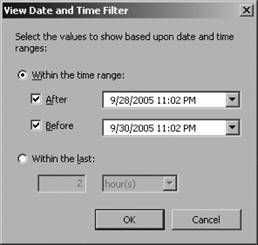 |
 Console Settings configuration page, as shown in Figure 6-25:
EAN: 2147483647
Pages: 107