Reviewing Assignments
|
|
The views you use to assign resources are task views. The Gantt Chart view, for example, displays tasks and the resources assigned to the tasks. Project also includes resource forms, so you can see resources and their tasks. The forms are used to review assignments from the point of view of the people assigned to them or to see where materials are used in the project. You can’t print the resource forms. The Resource Usage view, which can be printed, combines a timeline with tasks grouped by resource to show the hours that the resource is assigned to tasks each day.
Using the Resource Name Form The Resource Name form displays limited information about tasks assigned to a resource. To display the Resource Name form, choose ViewØMore ViewsØResource Name Form to open the Resource Name form, shown in Figure 10.10. Double-click a task to open the Task Information form for the task. Use the Previous and Next buttons to move from resource to resource.
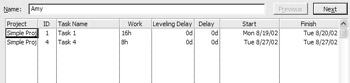
Figure 10.10: The Resource Name form
Using the Resource Form The Resource Form, shown in Figure 10.11, includes editable information fields for the resource, such as standard, overtime, and per-use rates. Double-click a task to open the Task Information form for the task. Use the Previous and Next buttons to move from resource to resource.
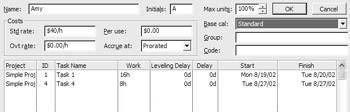
Figure 10.11: The Resource form
Using the Resource Usage View The Resource Usage view gives you an easy way to view each resource’s scheduled periodic activity. In this view, project tasks are grouped by resource, and resources are listed in alphabetical order. Figure 10.12 shows the Resource Usage view for the Decentralization project used as an example in previous chapters.
Unassigned tasks, if any, are listed at the top of the view. Click the Collapse button in front of a resource name to hide the list of tasks assigned to the resource. If assignment detail is hidden, click the Expand button to expand the view and display the resource’s assignments. Overallocated resources and assignments that cause overallocations are formatted with red text in this view. We’ll discuss resource allocation in the next chapter.
In all of the above forms, the total hours shown in a resource’s Work column is resource work. The total hours of assignment for each time period are shown in the same row of the grid. Assignment hours allocated in the grid are called timescaled or timephased hours. The resource’s assignments are listed under the resource. The total time that the resource is assigned to the work, assignment work, is shown in the Work column. Timephased hours for each assignment are displayed in the grid.
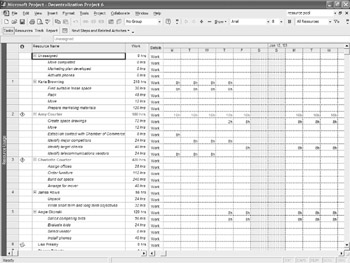
Figure 10.12: The Resource Usage view displays tasks grouped by resource.
Applying a Different Rate Table to an Assignment
Project lets you enter up to five different rate tables for a resource. To do this, you use the Costs tab of the Resource Information dialog box, shown here:
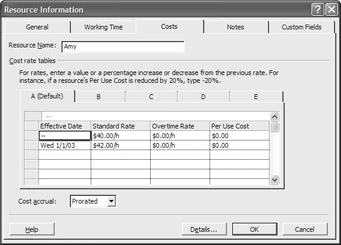
When you assign a resource, Project uses the rate from Cost Rate Table A. To use a rate from a different table for an assignment, double-click the assignment in the Resource Usage view to open the Assignment Information dialog box, as shown in Figure 10.13. On the General tab, select the rate table you want to use from the drop-down list and then click OK to apply the rate table.
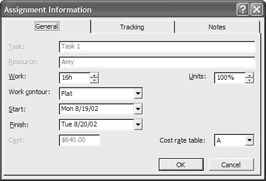
Figure 10.13: Apply a different cost table in the Assignment Information dialog box.
|
|
EAN: 2147483647
Pages: 241