Section 5.4. Customizing the Application
5.4. Customizing the ApplicationThe design of the application makes it easy to change. Using separate worksheets to isolate the data, the logic, and the display means that they can be modified without disturbing each other. First we will rearrange the Display sheet. 5.4.1. Changing the Display SheetRearranging the elements on the Display sheet is just a matter of dragging the controls and chart to new locations. The areas that reference named ranges can be cut and pasted without interfering with their formulas. By using these techniques and changing patterns and borders, the Display sheet can be rearranged to look like Figure 5-16 in a couple of minutes. Figure 5-16. A new Display sheet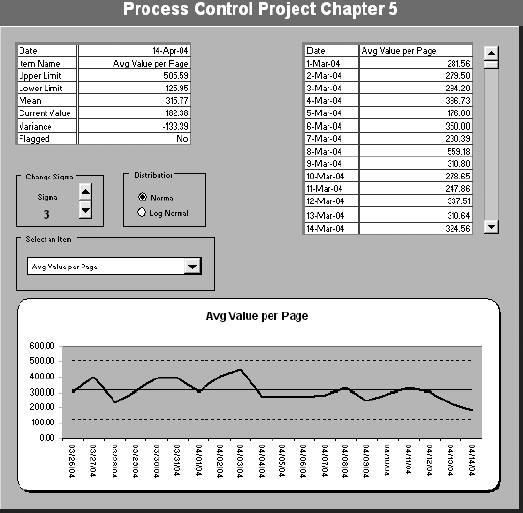 5.4.2. Adding LogicIn Statistical Process Control, it is considered significant if the metric being measured has been on the same side of the average for three consecutive days. This could mean that a trend has started. A serious problem can start slowly. So, we want to be alerted if the last three days were higher or lower than average even if we are still within the control limits. We start on the Workarea sheet, as in Figure 5-17. Figure 5-17. Adding new Logic to Workarea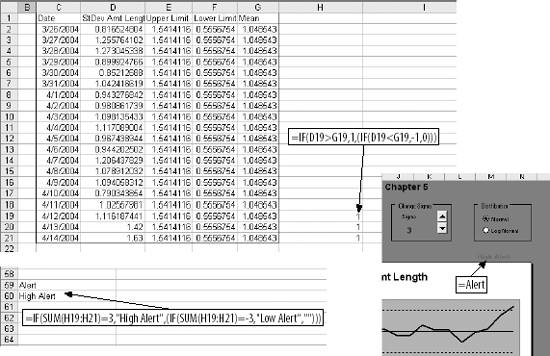 The last three days are in rows 19 through 21 in column D. In cell H19 we enter =IF(D19>G19,1,(IF(D19<G19,-1,0))). This is a nested IF function that returns 1 if the metric is above average, -1 if it is below, or 0 if it is equal to the average. The formula is filled down to cell H21. If the sum of H19:H21 is 3 or -3, the metric has been on the same side of the average for three days in a row. In cell A60 another nested IF function builds the alert. A result of blank is returned if there is no alert. This cell is named Alert. On the Display sheet in M8, just above the upper-right corner of the chart, the formula =Alert is entered. The cell is formatted bold and red. If there is no alert, the value is blank so the user sees nothing. 5.4.3. Adding a MacroThe way the application works, the user selects and checks each metric separately. It would be better if the application cycled through all of the metrics and only stopped on ones that are flagged as out of limits. The following VBA code will do the job. Sub FindProblem( ) '***************************** ' Macro to cycle through all ' of the metrics stopping ' if any are out of limits. ' The macro starts at the ' current position in the ' list of metrics. ' If no out of limits ' condition is found ' the macro returns to ' the first metric ' and diplays a message. '******************************* ' Range A9 is linked to the combo box on ' the display sheet. We start by adding ' one to this cell to advance one metric ' in the list. Range("Workarea!A9").Value = Range("Workarea!A9").Value + 1 ' We now setup a loop to continue checking ' metrics until a flagged item is found or ' all of the metrics have been checked. ' NameofItem contains the name of the metric being ' checked. If it is equal to zero the end of ' the list has been reached While Range("Flagged").Value = 0 And Range("NameofItem").Value <> 0 ' In the loop one is added to the ' value in A9 advancing through the list. Range("Workarea!A9").Value = Range("Workarea!A9").Value + 1 Wend ' The loop has ended so we have either found ' a flagged item or we are at the end. ' If we are at the end we need to take action ' so we check. ' If NameofItem is zero we are at the end. If Range("NameofItem").Value = 0 Then ' Return to the first item in the list. Range("Workarea!A9").Value = 1 ' Put up a message box. MsgBox ("No alerts found.") End If End Sub To add the code to the application, select Tools Next, type or paste in the code. After the code has been entered go back to the Macros dialog box and with FindProblem highlighted, click on Options... This will bring up a dialog box allowing you select a short cut key to run the macro. Enter a lowercase "e" as the shortcut key. The macro can now be run by pressing Ctrl-e. |
 Macro
Macro EAN: 2147483647
Pages: 101