Chapter 1: Introduction to Data Warehousing and Analysis Services 2005
A data warehouse is a system that takes data from a company's databases and other data sources and transforms it into a structure conducive to business analysis. Mathematical operations are often performed on the newly structured or organized data to further its usefulness for making business decisions. Finally, the data is made available to the end user for querying and analysis. If the data warehouse is well architected then queries to the data warehouse will return query results quickly (in a matter of seconds). The business decision-maker will have a powerful tool that could never have been effectively used directly from the company's daily operational systems. We consider data analysis to be of two forms. The first requires a person to investigate the data for trends. This method is called On Line Analytical Processing (OLAP). The second form utilizes algorithms to scour the data looking for trends. This method is called Data Mining. Analysis Services 2005 is a business intelligence platform that enables you to use OLAP and Data Mining. Now that you have the big picture of data warehousing, let us look at what you will learn in this chapter.
In this chapter you learn what data warehousing really is and how it relates to business intelligence. This information comes wrapped in a whole load of new concepts, and you get a look at the best known approaches to warehousing with the introduction of those concepts. We explain data warehousing in several different ways and we are sure you will understand it. You will finally see how Analysis Services 2005 puts it all together in terms of architecture — at both client and server levels — based on a new data abstraction layer called Unified Dimensional Model (UDM).
A Closer Look at Data Warehousing
In the book Building the Data Warehouse, Bill Inmon described the data warehouse as "a subject oriented, integrated, non-volatile, and time variant collection of data in support of management's decisions." According to Inmon, the subject orientation of a data warehouse differs from the operational orientation seen in On-Line Transaction Processing (OLTP) systems; so a subject seen in a data warehouse might relate to customers, whereas an operation in an OLTP system might relate to a specific application like sales processing and all that goes with it.
The word integrated means that throughout the enterprise, data points should be defined consistently or there should be some integration methodology to force consistency at the data warehouse level. One example would be how to represent the entity Microsoft. If Microsoft were represented in different databases as MSFT, MS, Microsoft, and MSoft, it would be difficult to meaningfully merge these in a data warehouse. The best-case solution is to have all databases in the enterprise refer to Microsoft as, say, MSFT, thereby making the merger of this data seamless. A less desirable, but equally workable, solution is to force all the variants into one during the process of moving data from the operational system to the data warehouse.
A data warehouse is referred to as non-volatile since it differs from operational systems, which are often transactional in nature and updated regularly. The data warehouse is generally loaded at some preset interval, which may be measured in weeks or even months. This is not to say it is never measured in days; but even if updates do occur daily, that is still a sparse schedule compared to the constant changes being made to transactional systems.
The final element in this definition regards time variance, which is a sophisticated way of saying how far back the stored data in the system reaches. In the case of operational systems, the time period is quite short, perhaps days, weeks, or months. In the case of the warehouse, it is quite long — typically on the order of years. This last item might strike you as fairly self-evident because you would have a hard time analyzing business trends if your data didn't date back further than two months. So, there you have it, the classic definition that no good book on data warehousing should be without.
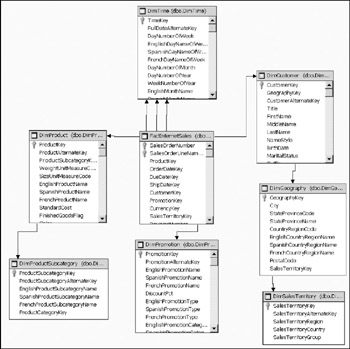
Taking the analysis one step closer to the nuts and bolts of working systems, consider that a relational database can be represented graphically as an Entity-Relationship Diagram (ERD) in a case tool or in SQL Server 2005 itself (see Figure 1-1 for an example). Not only will you see the objects in the database shown in the diagram, but you will also see many join connections which represent the relationships between the objects. Data warehouses can be formed from relational databases or multi-dimensional databases. When your data warehouse is modeled after the relational database model then data is stored in two-dimensional tables and analytical or business queries are normally very slow. When one refers to a data warehouse it is typically OLAP that is being referred to. In the case of OLAP you have a multi-dimensional database with data stored in such a way that business users can view it and efficiently answer business questions — all with fast query response times. There is more to come in this chapter on the differences between relational and OLAP databases.

Figure 1-1
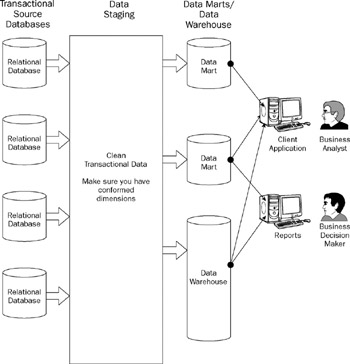
Data warehousing is the process by which data starting from an OLTP database is transformed and stored so as to facilitate the extraction of business-relevant information from the source data. An OLTP database, like a point-of-sale (POS) database is transaction-based and typically normalized (well optimized for storage) to reduce the amount of redundant data storage generated. The result makes for fast updates, but this speed of update capability is offset by a reduction in speed of information retrieval at query time. For speed of information retrieval, especially for the purpose of business analytics, an OLAP database is called for. An OLAP database is highly denormalized (not well optimized for storage) and therefore has rows of data that may be redundant. This makes for very fast query responses because relatively few joins are involved. And fast responses are what you want while doing business intelligence work. Figure 1-2 shows information extracted from transactional databases and consolidated into multidimensional databases; then stored in data marts or data warehouses. Data marts can be thought of as mini–data warehouses and quite often act as part of a larger warehouse. Data marts are subject-oriented data stores for well-manicured (cleaned) data. Examples include a sales data mart, an inventory data mart, or basically any subject rooted at the departmental level. A data warehouse on the other hand, functions at the enterprise level and typically handles data across the entire organization.

Figure 1-2
EAN: 2147483647
Pages: 176