Pie Charts
|
| < Day Day Up > |
|
To create a pie chart, select Graphs → Pie Chart...
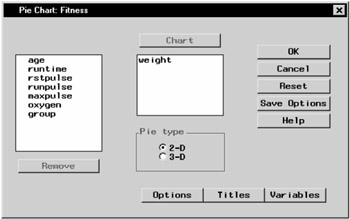
Figure 5.17: Pie Chart Dialog
Select variables from the candidate list and click on the Chart button to produce a pie chart for each variable.
Select 2-D or 3-D under Pie type to specify whether you want to display a two-dimensional or three-dimensional chart.
Pie Chart Options
In the Pie Chart Options dialog, you can control the appearance of your pie chart. Click on the Options button to display the Pie Chart Options dialog. Click OK to save your changes.
Number of Slices
The Number of Slices tab enables you to specify the number of slices in the chart and the levels for which they are displayed.
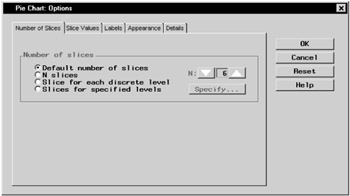
Figure 5.18: Number of Slice Tab
Under Number of slices, select Default number of slices to display an algorithmically determined number of slices. Select N slices and select a number from the list to specify the number of slices to be displayed. Select Slice for each discrete level to display a slice for each discrete level of data. If you are charting no more than one variable, select Slices for specified levels and click on the Specify button to provide a list of midpoints or to specify a range of numeric values, or to provide a list of character values.
Slice Values
The Slice Values tab enables you to control the type of information that is displayed by each slice by specifying the statistic to display in the chart and any additional variable to use in computing the statistic.
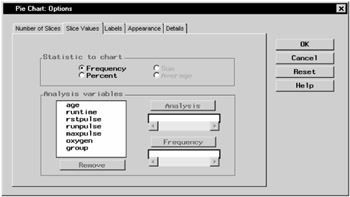
Figure 5.19: Slice Values Tab
Selecting Frequency under Statistic to chart causes each slice to represent the frequency with which a value or range of values occurs for the chart variable. Selecting Percent causes each slice to represent the percentage of observations of the chart variable having a given value or falling into a given range.
If you want to show some characteristic of an additional variable for each level of the chart variable, select the additional variable as an Analysis variable. Then you can select Sum or Average of the analysis variable as the statistic to compute and display in each slice.
Select a Frequency variable if each observation in the data set represents several real observations, with values of the frequency variable indicating that number.
Labels
The Labels tab enables you to define the labels for the slices in the pie chart.
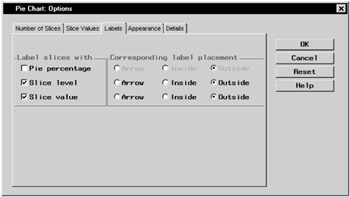
Figure 5.20: Labels Tab
Under Label slices with, you can choose to label the slices with their percentage of the pie chart, the level of the slice, and the value of the slice.
Under Corresponding label placement, you can place each of the labels inside or outside the slice, or you can include an arrow that points from the label to the slice.
Appearance
The Appearance tab enables you to select colors, fonts, and line width.
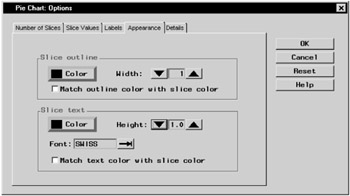
Figure 5.21: Appearance Tab
Under Slice outline, select the check box if you want the outline of each slice to be the same as the slice color. You can also control the width of the slice outlines. To select one color to be used for all outlines, click on the Color button and select a color from the Color Attributes dialog.
Under Slice text, select the check box if you want to match the color of the text with the color of the slice. You can also control the height and font of the slice text. To select one color to be used for all text, click on the Color button and select a color from the Color Attributes dialog.
Details
The Details tab enables you to specify slice and chart heading options.
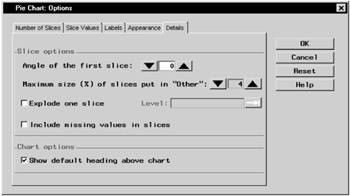
Figure 5.22: Details Tab
Under Slice options, you can specify the angle in degrees of the first slice by clicking on the up or down arrows or by typing in the degree. You can also define the maximum percentage size of slices you want to gather into an Other category by clicking on the arrows to choose from a range of one to fifteen percent. If you are charting one variable, you can select Explode one slice, and type in the level. If you have selected Slice for each discrete level or Slices for specified levels in the Number of Slices tab, you can click on the arrow next to Level: to select from a range of levels.
You can choose to include missing values in slices.
Under Chart options, you can select Show default heading above chart to include a heading that summarizes what the chart displays.
Pie Chart Titles
Click on the Titles button to display the Titles dialog.
In the Global tab, you can specify titles that are displayed on all output. These titles are saved across Analyst sessions.
In the Pie Chart tab, you can specify titles for the pie chart. Select the box next to Override global titles to exclude the global titles from the pie chart results.
In the Settings tab, you can specify whether or not to include the date, page numbers, and a filter description.
Pie Chart Variables
Click on the Variables button to display the Pie Chart Variables dialog.
BY group variables separate the data set into groups of observations. Separate analyses are performed for each group, and a separate chart is displayed for each analysis. For example, you could use a BY group variable to perform separate analyses on females and males. Specify BY group variables by selecting them in the candidate list and clicking on the BY Group button.
Example: Create a 3-D Pie Chart
Open the Fitness Data Set
In this example, you create a pie chart from the Fitness data set. If you have not already done so, open the Fitness data set by following these steps:
-
Select Tools → Sample Data...
-
Select Fitness.
-
Click OK to create the sample data set in your Sasuser directory.
-
Select File → Open By SAS Name...
-
Select Sasuser from the list of Libraries.
-
Select Fitness from the list of members.
-
Click OK to bring the Fitness data set into the data table.
Specify Pie Chart Variable
To specify the variable to be charted and the chart type, follow these steps:
-
Select Graphs → Pie Chart...
-
Select runtime from the candidate list, and click Chart to make minutes to run 1.5 miles the charted variable.
-
Select 3-D under Pie type to specify a three-dimensional chart.
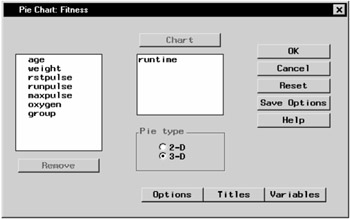
Figure 5.23: Pie Chart Variable and Type
Specify Pie Chart Options
To specify your pie chart options, such as the number of slices, follow these steps:
-
Click on the Options button to display the Pie Chart Options dialog.
-
In the Number of Slices tab, design a chart with ten slices by selecting N slices and clicking on the up arrow until the number 10 is visible.
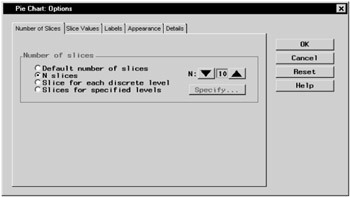
Figure 5.24: Number of Slices in Pie Chart -
In the Slice Values tab, select Percent under Statistic to chart in order to chart the percentage of each runtime in relation to the whole.

Figure 5.25: Statistic to Chart -
In the Labels tab, select Slice level under Label slices with. Select Arrow under Corresponding label placement. Each slice indicates a runtime, and each label is placed outside the disc, with an arrow pointing to the corresponding slice.
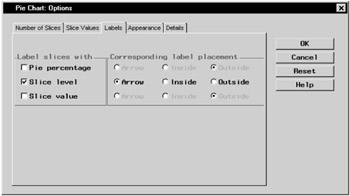
Figure 5.26: Pie Chart Labels -
In the Details tab, deselect Show default heading above chart under Chart options. You provide a new heading in the Titles dialog.
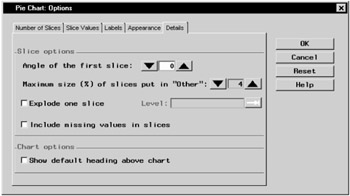
Figure 5.27: Deselect Default Heading -
Click OK to save your changes and return to the Pie Chart dialog.
Specify Pie Chart Titles
To specify the titles for your pie chart, follow these steps:
-
Click on the Titles button in the Pie Chart dialog.
-
In the Pie Chart tab, type Percentage of Each Runtime in the first field.
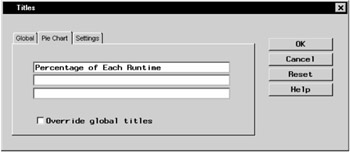
Figure 5.28: Pie Chart Title -
If you did not change the global title in the first exercise in this chapter, click on the Global tab. Type Fitness Report in the first field. This global title is saved across all Analyst sessions until you change it.
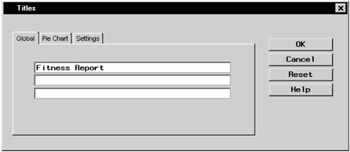
Figure 5.29: Global Title -
Click on OK to save your title changes.
Generate Pie Chart
To display your pie chart, click OK in the Pie Chart dialog.
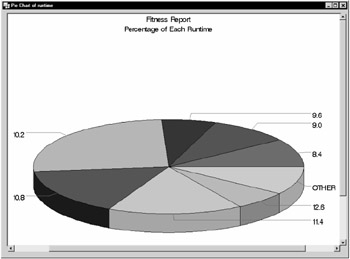
Figure 5.30: 3-D Pie Chart
|
| < Day Day Up > |
|
EAN: 2147483647
Pages: 116