Entering Data in the Datasheet
| The default datasheet that opens when you first create a chart includes four columns and three rows. This is a common chart formatcomparing specific categories over periods of timebut only one of the hundreds of possible formats. Figure 11.12 illustrates this datasheet. Figure 11.12. Enter chart data in a datasheet, similar to an Excel worksheet. The first row and column of a datasheet serve as headers for the information in the datasheet. Therefore, the second row begins with the number 1 and the second column with the letter A. In this example, the columns display as the category axis, the rows display as the data series listed in the legend, and the cell data (A1:D3) represents the value axis. TIP To input your own data, just type over the existing information in each cell.
Inserting and Deleting Datasheet Rows and ColumnsTo delete a row or column, place the cursor within the appropriate row or column and choose Edit, Delete from the menu. To remove the contents of a cell rather than the cell itself, choose Edit, Clear, Contents. Clearing the contents is best when you want to remove existing data and replace it with new data. If you no longer need the row or column, you should delete it. You can delete a row or column by selecting its heading and pressing the Delete key. NOTE You can also cut (Ctrl+X), copy (Ctrl+C), and paste (Ctrl+V) data in the datasheet by using keyboard commands or by choosing the appropriate buttons on the Standard toolbar. To insert a new row, select the row below where you want to place the new row and choose Insert, Cells . Microsoft Graph inserts a new row directly above the selected row. To insert a new column, select the column heading to the right of where you want to place the new column and choose Insert, Cells. Microsoft Graph inserts a new column directly to the left of the selected column. If you want to insert a new cell, rather than a complete row or column, select the cell where you want to insert a cell; choose Insert, Cells; and choose either Shift Cells Right or Shift Cells Down in the Insert dialog box (see Figure 11.13). Figure 11.13. Determine the direction to move the existing cells in the Insert dialog box. PowerPoint inserts a new cell and shifts the row to the right or shifts the column down, depending on your selection. You can undo insertions and deletions by clicking the Undo button or pressing Ctrl+Z. Formatting Datasheet Column WidthTo format the datasheet's column width, follow these steps:
Formatting Datasheet NumbersYou can format the text and numbers in your datasheet if you want. To format numerical data, select the cell or cells you want to format and choose Format, Number. The Format Number dialog box appears, as shown in Figure 11.15. Figure 11.15. Customize the way numbers appear in this dialog box. Select the type of number format you want from the Category list, such as date, time, or currency format. Based on your category selection, the right side of the dialog box offers additional formatting options related to the category. For example, if you choose Currency, the right side of the dialog box lets you choose the currency symbol such as the dollar, pound , or yen. Several of the numeric categories also let you choose the number of decimal places you want to include. Click OK to accept the formatting changes and to update your chart.
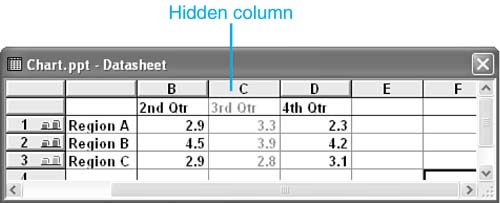
Including and Excluding Rows and ColumnsYou can include rows and columns in your datasheet, but temporarily hide them in your presentation. To do that, select the column or row that you want to hide, and choose Data, Exclude Row/Col. The row or column appears shaded in your datasheet and temporarily disappears from your presentation. Figure 11.16 shows an example of a hidden column in a datasheet. Figure 11.16. This hidden column will temporarily be removed from the chart. To include this information again, choose Data, Include Row/Col. TIP You can also double-click the row or column head to include or exclude the rows or columns. In this case, the action serves as a toggle. Returning to the Presentation from the Datasheet To reopen the datasheet, click the View Datasheet button again. |
EAN: 2147483647
Pages: 261