Debugging Scenario Questions
| In this section, I want to talk about some of those very cool tricks in my debugging arsenal that come in handy in specific scenarios. Some of these techniques appear in the documentation, but they are so obscure that you may have never heard of them. How do I debug assembles in the Global Assembly Cache (GAC)?If you have a situation in which your assembly can reside only in the GAC, debugging can get a little interesting because getting PDB files loaded can be a pain. If you're working on the machine on which the assembly was built, the embedded path in the binary will find the PDB file, but if you're on a different machine, you may not find it. You could also go to the trouble of creating a mini Symbol Server, as I discussed in Chapter 2, in order to get the symbols. The good news is that there's an easier way. The technique is to use the DEVPATH environment variable. By enabling DEVPATH, you're telling the assembly loader to look in the specified directory before looking at the GAC or the application directories. Additionally, although name, culture, public key token and processor architecture checking is done on the assembly, no version checking is done at all. This means that you can potentially have a situation in which the application runs differently on your development machine than in test or production. Interestingly, the lack of version checking can be valuable if you want to see how your application will work with a newer version of the assembly without having to remove the old one from the GAC. Warning
To enable DEVPATH, you must turn it on in the <runtime> section of Machine.Config, which you can find in %SystemRoot%\Microsoft.NET\Framework\versison\CONFIG. The following shows what you would add: <configuration> <runtime> <developmentMode developerInstallation="true"/> </runtime> </configuration> Once you have the <developmentMode> section set, you need to set the DEVPATH environment variable to the drive and directory where you want the runtime to look first. For .NET 2.0, you can specify only a single directory in the DEVPATH environment variable. If you leave the PDB file for the assembly in the DEVPATH specified directory, the debugger will load the PDB file from that directory. For more information about DEVPATH, see Junfeng Zhang's blog entry on DEVPATH at http://blogs.msdn.com/junfeng/archive/2005/12/13/503059.aspx. How can I debug the startup code for a Windows service written in .NET?Whereas you can easily attach to your service with Visual Studio once your Windows service is running and debug to your heart's content, debugging the startup code is an adventure. Because the Service Control Manager (SCM) is what has to call the CreateProcess API to get the service started, you can't start from the debugger. The traditional way of debugging service startup is through the Image File Execution Options registry key, and if your service is written in a managed language, you can still use the Image File Execution options. The Image File Execution Options registry key (HKEY_LOCAL_MACHINE\SOFTWARE\Microsoft\Windows NT\CurrentVersion\Image File Execution Options) is where the operating system reads special values for setting global flags in the process. Additionally, you can also set a debugger so that no matter how you start the application, it always starts under a debugger. Keep in mind that the instructions I'm about to discuss apply only to 32-bit Windows systems. The reason is that the debugger program I'll show you in this trick is 32-bit only, so it can't debug 64-bit programs. If you're feeling hard core and looking for adventure, you'll manually go into the Image File Execution Options key and start adding the appropriate entries. If that thought scares you, you can do what us normal people do, use GFlags.exe, which comes with the Debugging Tools for Windows package. Since the Image File Execution Options key is in HKEY_LOCAL_MACHINE, you'll have to run GFlags.exe from an account with administrator privileges. Before we go any further, I have to scream, You can make your machine unbootable and unusable with GFlags! When you start GFlags, the first two tabs, System Registry and Kernel Flags, will change system-wide settings you don't want to change unless you work at Microsoft on the Windows kernel team and have full source code access. For you and me, as soon as you start GFlags, you want to click the Image File tab as fast as possible. In the Image File tab, you'll be limited to screwing up just the individual process. On the Image File tab, in the edit control next to the Image: (TAB to refresh) label, type in only the name of your service with no path. In other words, if your service were happyserv.exe, that's exactly what you'd type. To enable the rest of the UI in Image File tab, press the Tab key after typing the name of your application. The Debugging Tools for Windows help file, Debugger.chm, documents all of the various check boxes for a process. As you can guess from the names of the fields, all of them are for native memory debugging. For debugging your service startup, the two items of interest are the Debugger check box and text box. After selecting the Debugger check box, the text box becomes available, and you can specify the debugger you want to use. You won't type Devenv.exe here (the Visual Studio program name), but you'll type VsJITDebugger.exe, which is the Visual Studio Just-In-Time Debugger. There's no need to specify the path because the debugger is installed into the %SystemRoot%\System32 directory. Figure 4-4 shows a properly filled out GFlags screen shot. Figure 4-4. Setting the Image File Execution Options debugger value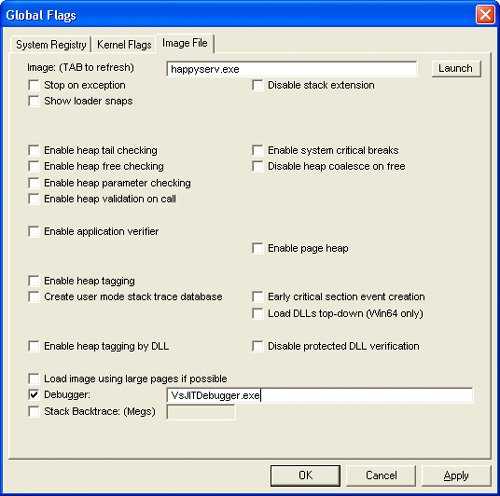 When your service or any other program you specify starts, the operating system passes the program and any command-line arguments to VsJITDebugger.exe so you'll see the usual Visual Studio Just-In-Time Debugger dialog box asking you which debugger to use on the process. What's interesting about the undocumented behavior of VsJITDebugger.exe is that it sees your process is a managed process and enables mixed-mode (both managed and native) debugging. As I mentioned, this trick won't work on x64 systems, so if you have to debug service startup on the wide bits, set the debugger to Windbg.exe. Because WinDBG is a native-only debugger and doesn't support .NET debugging, you'll have to use the SOS extension to debug your startup. Chapter 6 discusses WinDBG and SOS in detail. Although painful, it is doable but not something you want to do every day. Even if you haven't done Windows service development before, you're probably aware that there's a startup timeout when starting a service. If your service does not call back into the SCM within 30 seconds of starting, the SCM will terminate the service. This isn't a lot of time to let Visual Studio start up and load all the symbols let alone for you to single-step through the service startup. Fortunately, there's another barely documented registry tweak in which we can set the timeout value: In the HKEY_LOCAL_MACHINE\SYSTEM\CurrentControlSet\Control key, create a new DWORD value called ServicesPipeTimeout, and set the number of milliseconds you want the SCM to wait for service startup. After you set this value, you'll need to reboot the computer for the change to take effect. Obviously, you want to set the Services-PipeTimeout value on a production server because it's global to all services. My boss is sending me so much e-mail that I can't get anything done. Is there any way I can slow down the dreaded PHB e-mail?Although many of your bosses mean well, their incessant e-mail messages can become distracting and keep you from the real work you need to do. Fortunately, there's a simple solution that works quite well and will give you a week or so of wonderful peace so that you can work at hitting your deadlines. The less-technically proficient your boss and network administrators are, the more time you'll get. In the previous section, I talked about the Image File Execution Options section of the registry and the fact that whenever you set a process's Debugger value, that process automatically starts under that debugger. The trick to ending the PHB (pointy haired boss) mail is the following:
Avoiding laughter during this experiment is much more difficult than it sounds, so you might want to practice these steps with a few coworkers first. What you've just set up is a situation in which every time your boss starts Outlook, Solitaire runs instead. (Since most bosses spend their days playing Solitaire anyway, your boss will be sidetracked for a couple of games before he realizes that he meant to start Outlook.) Eventually, he'll continue to click the Outlook icon until so many copies of Solitaire are running that he'll run out of virtual memory and have to reboot his machine. After a couple of days of this click-a-million-times-and-reboot cycle, your boss will eventually have a network administrator come in and look at his machine. The admin will get all excited because she has a problem that is a little more interesting than helping the folks in accounts receivable reset their passwords. The admin will play with the machine for at least a day in your boss's office, thus keeping your boss from even being close to a machine. If anyone asks your opinion, the stock answer is, "I've heard of strange interaction problems between EJB and NTFS across the DCOM substrata architecture necessary to access the MFT using the binary least squares sort algorithm." The admin will take your boss's machine back to her office and continue to play with it for a couple of days. Eventually, the admin will repave the hard disk and reinstall everything on the machine, which will take another day or so. By the time your boss gets his machine back, he'll have four days of e-mail to get through, so it will be at least a day before he gets out from under all that mail, and you can safely ignore those messages for another day or two. If the PHB mail starts getting thick again, simply repeat the steps. Warning
What strategies do you have for debugging deadlocks?Without a doubt, some of the hardest problems to solve in modern software development are deadlocks. In fact, I spend a considerable amount of time showing you how to find them in Chapter 6, and I even wrote Code Analysis/FxCop rules in Chapter 8, "Writing Code Analysis Rules," to help ensure that you're following proper multithreading in managed code. However, even if you think you can plan for every situation, your multithreaded application can stop dead when you least expect it. The biggest obstacle to debugging multithreaded deadlocks is that by the time your application is deadlocked, it's almost too late to start debugging. As I've been emphasizing throughout this book, one of the keys to debugging is up-front planning. With multithreaded programming, up-front planning is the only way you can avoid the dreaded deadlocks. I break down the necessary planning for multithreaded applications into the following categories:
Don't Do ItThis first tip might seem a little facetious, but I'm absolutely serious. Make sure there's no other way you can structure your program before you decide to incorporate multithreading into your application. When you include multithreading in your application, you're easily adding a minimum of an extra month of development and testing to your schedule. If you're coding thick-client applications and you need your program to do some lightweight background processing, check to see whether the work can be handled with a background periodic timer event. With a little creative thinking, you can probably find a way to avoid multithreading and the headaches that go with it. Don't Overdo ItWhen it comes to server-based applications, you also have to be extremely careful not to create too many threads. One common mistake we've all seen is that some developers end up with a server application in which each connection runs on its own thread. The average development team is doing well to get 10 concurrent connections during their heaviest testing, and it looks like their code works fine. The code might work fine when first deployed, but as soon as business picks up, the server starts bogging down because it's not scalable. When working on server applications, you'll definitely want to take advantage of the excellent support .NET has for thread pooling with the .ThreadPool class from the System.Threading namespace. If used properly, you can get some wonderful throughput in your application. However, it's much easier to deadlock with misused thread pools than you can ever imagine. For more information on using the ThreadPool class, see Chapter 23, "Performing Asynchronous Operations," in CLR via C#, 2nd Edition. Multithread Only Small, Discrete PiecesIf you must multithread, try to keep it to small, discrete pieces. With thick-client applications, you should stick to small pieces of work that are generally devoid of any user interface (UI) elements. For example, printing in the background is a smart use of multithreading because your application's UI will be able to accept input while data is printing. In server applications, it's slightly different in that you need to judge whether the overhead of thread creation and work will actually speed up your application. Although threads are much more lightweight than processes, they still take quite a bit of overhead. Consequently, you'll want to make sure that the benefit of cranking up that thread will be worth the effort. For example, many server applications have to transfer data back and forth between some type of database. The cost of waiting for the write to that database can potentially be high. If you have a situation in which you don't need to do transactional recording, you can plop parts of the database write into a thread pool object and let it complete on its own time, and thus continue your processing. That way you'll be more responsive to the calling process and get more work done. Synchronize at the Lowest LevelIn my travels, I've seen this rule broken almost more than the rule that says curly braces go below the if statement. In .NET, it's trivial to use a lock statement on a field and grab it at the top of your method so you protect the whole method, when in reality; you need to protect just a single field access. Whenever you grab a lock or other synchronization object, you're causing other threads to block when they try to access that object. Your job as a developer using multithreading is to keep your threads running as much as possible and never block. It's far better to do three or four synchronization object grabs in a method instead of doing a single overall grab. Review the Codeand Review the Code AgainIf you really do need to multithread your application, you must allow plenty of time to walk through your multithreaded code in full code reviews. The trick is to assign one person to each thread in your code and one person to each synchronization object. In many ways, the code review in multithreaded programming is really a "multithreaded" review. When you review the code, pretend that each thread is running at real-time priority on its own dedicated CPU and that the thread is never interrupted. Each "thread person" walks through the code, paying attention only to the particular code that his thread is supposed to be executing. When the thread person is ready to acquire a synchronization object, the "object person" literally moves behind the thread person. When the thread person releases a synchronization object, the object person goes to a neutral corner of the room. In addition to the thread and object representatives, you should have some developers who are monitoring the overall thread activity so that they can assess the program's flow and help determine the points at which different threads deadlock. Test on Multiprocessor MachinesAs I mentioned, a multithreaded application requires a much higher level of testing than a single-threaded one. The most important tip I have for testing your multithreaded application is to test it thoroughly on multiprocessor machines. And I don't mean simply running your application through a few paces; I mean continually testing your program in all possible scenarios. Even if your application runs perfectly on single-processor machines, a multiprocessor machine will expose deadlocks you never thought possible. The best approach to this kind of testing is to have the team's developers run the application on multiprocessor machines every day. If you're a manager and you don't have any multiprocessor machines in your shop, stop reading right now and immediately equip your developers and QA testers with multiprocessor machines! If you're a developer without a multiprocessor machine, show this chapter to your manager and demand the proper equipment to do your job! Several people have written me and mentioned that showing this section really did help them get a multiprocessor machine, so don't hesitate to tell your manager that John Robbins said the company owed you one. How do you debug design-time assemblies? How do you debug add-ins?No matter if you're developing the world's greatest ASP.NET component or the world's best add-in, debugging those items is exactly the same. Anything loading into Visual Studio means that you'll be debugging Visual Studio itself. For your assembly, go into the project properties, Debug tab, and then click Start External Program. In the text box, you'll specify the path and directory to Devenv.exe. If Devenv.exe is in your PATH environment variable, which I would highly recommend, all you need to add is Devenv. To debug your design-time components or add-ins, open the source file you want to debug and set a breakpoint. Whenever your assembly is loaded, Visual Studio will load the symbols and match up the source and line information from the breakpoint you've set. If it's a valid breakpoint, you'll break at the location. To make it easier to set up debugging, the SettingsMaster add-in I discuss in Chapter 7, "Extending the Visual Studio IDE," makes it trivial to set up a .SettingsMaster file with your common debugging settings so you can apply those settings with a click of the mouse. How do you debug assembly-loading issues?In the native C++ days, it was straightforward to find out why a LoadLibrary could not find a particular DLL. However, in the .NET world, things are a little bit different because we have things such as the GAC, satellite assemblies, <probing> elements, and <dependentAssembly> elements; it can become quite tricky to figure out exactly where an assembly is supposed to be loaded from when you're staring at a FileLoadException. Fortunately, a mostly hidden utility that ships with the Framework SDK, the Assembly Binding Log Viewer, Fuslogvw.exe, can show you everything about assembly loading. The "Fus" in the program name stands for Fusion, which was the code name for the assembly loading portion of the CLR runtime. If you want to see assembly load details for any .NET program on a machine, start Fuslogvw.exe from an account with administrator rights and click the Settings button on the UI. One strange bug with Fuslogvw.exe is that unless you specify a custom logging directory, the logging won't work. In the Settings dialog box, select the Enable Custom Path check box, and in the text box, specify a directory on the disk. The rest of the Settings dialog box lets you specify if you want to disable logging, log exception text, log binding failures, and log all binding. It's quite eye-opening to look at how your application is going through the gyrations of loading assemblies, so I'd recommend that you click Log All Binds To Disk. Once your application starts, you can double-click any of the entries in the main window to see exactly how and what the .NET runtime was doing to look for the assemblies your program loaded. In the entries, you'll see exactly what was going on and where the runtime was looking for particular items so you can narrow down the assembly-loading problems. How can I always get the source and line information in any unhandled exception?You may have noticed that on your development machine when you're running your application, the unhandled exception stack walk shows the source and line of all items on the stack. If you would like the same information on your production systems, and you control those machines, all you need to do is include the PDB files in the same directory as the binary, and the .NET StackWalk class will automatically pick them up. As I described in Chapter 2, there are no secrets in NET PDB files like those in native code. They contain only the source and line information and the names of local variables. If you're having trouble seeing exactly where an unhandled exception is coming from, dropping the PDB files into the same directory as the binary will give you the exact location where the exception is originating without giving up too much information. |
EAN: 2147483647
Pages: 99