Debugger Questions
| Although Chapter 5, "Advanced Debugger Usage with Visual Studio," covers the amazing .NET debugger in Visual Studio, a few common questions fall outside the realm of pure .NET. I want to answer those questions here. Some of these are discussed in the Visual Studio documentation but are scattered around, so many developers aren't aware of the answers. I need a debugger on a production system. Do I have to purchase an additional copy of Visual Studio for that machine?The Visual Studio Express editions are free, but the Visual Web Developer edition does not support debugging inside Internet Information Services (IIS), so that doesn't work. The good news is that the Framework SDK includes the Microsoft CLR Debugger (DBGCLR) as part of its installation. DBGCLR is essentially the Visual Studio main frame with nothing but the managed debugging packages, which means that the memory footprint is almost trivial when compared to the full version of Visual Studio. The Framework SDK is also free, and you can download it from http://msdn.microsoft.com/netframework/. When you install the Framework SDK, make sure to select Custom Installation, and install only the tools portion to get just what you need. What is that VSHOST thing?In Windows, process creation is a relatively slow operation. Consequently, for .NET 2.0, the debugger team took advantage of the fact that there's no difference between EXEs and DLLs in the .NET world. The debugger keeps AppName.vshost.exe running as you're developing, and when you start debugging, they communicate to it to load your actual EXE into a separate AppDomain and execute all your code there. There's a noticeable speed increase with the Vshost approach, and in almost all instances, you won't have any problems running in the default scenario. However, if you rely on certain Framework APIs, such as AppDomain.CurrentsDomain.FriendlyName and Assembly.GetCallingAssembly().FullName, which obviously return different values if you're running under the AppName.vshosts.exe process. If your code absolutely relies on the running application, you can always resort to debugging the binary directly by going into the project properties, and on the Debug tab, clearing Enable The Visual Studio Hosting Process check box. Can you debug SQL stored procedures by using Visual Studio?Absolutely! You can debug all the SQL Server 2000 and SQL Server 2005 stored procedures you want by using Visual Studio because the support has been drastically improved. The one thing the documentation fails to mention is that you need to be a sysadmin for the SQL Server instances you'll want to debug. SQL Server 2005 is ready for debugging automatically, but for SQL Server 2000, you'll need to enable Visual Studio debugging each time it starts by executing the following statement in SQL Analyzer: exec sp_sdidebug 'legacy_on'. The Server Explorer tool window in Visual Studio is where you can create your data connections to the particular database you want to use. Once you've established the connection, you can manipulate the database to your heart's content. To execute or debug any stored procedure in the database, right-click the stored procedure, and then select either Execute or Step Into Stored Procedure as appropriate. If the stored procedure requires parameters, Visual Studio will prompt you for them. Single-stepping stored procedures is just like debugging any other type of code you'd debug in Visual Studio, so to see parameters and locals, use the Locals and Watch windows. You won't get to see temporary tables you create, but the convenience factor of using a single environment is wonderful. A known problem prevents you from stepping into stored procedures on some systems when you could do so on those systems in the past. To work around this bug, delete the database connections and re-create them. That should clear up the problem. While I'm talking about issues, I should mention that it's an excellent idea not to use the Server Explorer default of always being shown on the left side of the IDE with auto-hide enabled. If you have an invalid data connection in Server Explorer, and you move your pointer over the Server Explorer tab, the IDE will refresh the window right before showing it. Because the connection to the server is done on the UI thread, the whole IDE will hang for a minute or more. By the way, the same UI hang on network access occurs with the Team Explorer window used to view your Team Foundation System servers. In addition to stepping into stored procedures from Server Explorer, you can set up your projects so that you debug the stored procedures as your C# or Visual Basic code executes them. For console and Windows Forms applications, go into the project properties, and on the Debug tab at the bottom, select the Enable SQL Server Debugging check box. For ASP.NET projects, on the Web site menu, click Start Options, and in the Debuggers section of the Properties dialog box, select the SQL Server check box. In all cases, you'll need to open the stored procedure code from Server Explorer and set your breakpoints in the stored procedure before that stored procedure executes. Now you can step from your C# or Visual Basic code to the stored procedure and back. How do you debug script by using Visual Studio?Given the massive interest in all things AJAX, scripting with JavaScript and Microsoft Visual Basic, Scripting Edition (VBScript) are about to become quite important in your future. As is the case with SQL stored-procedure debugging, Visual Studio handles script debugging, but there are a few more twists along the way. Before debugging script in Microsoft Internet Explorer, you need to go into the Internet Options dialog box, and then on the Advanced tab, under the Browsing node, clear the Disable Script Debugging (Internet Explorer) check box. Note that if you want to debug scripts running with the HTML control in other applications, such as Microsoft Office Outlook, you'll also need to clear the Disable Script Debugging (Other) check box. In all ASP.NET scenarios, using the JavaScript debugger or VBScript Stop keywords will always break into the debugger. However, the danger is that you'll accidentally check in the source code with the breaking keywords still there, which most development teams frown on. It's much better to use the built-in script-debugging support in your ASP.NET projects if you can. However, the way you set your breakpoints depends on the type of page you're working with. If the page is an .html/.htm static HTML page, you can set your breakpoints in the <script> tags any time you like, and they will be hit. If the script is in an ASP.NET .aspx page, if you try to set a breakpoint, the IDE will complain that "This is not a valid location for a breakpoint." Even if you start debugging and you see the .aspx page loaded, you still won't be able to set a breakpoint. To solve this problem when you start debugging, on the Debug menu, click Windows, and then select Script Explorer to open the Script Explorer window. In the Script Explorer window, double-click the page that contains the script you want to debug. That will shift focus to the .aspx file, and you can set your breakpoints. One annoying problem with the ASP.NET script-debugging support is that none of the breakpoints you set in the script code is saved between debugging runs. That means that you'll have to manually set the script breakpoints each time. If you want to debug any client-side script running in an instance of Internet Explorer, on the Tools menu, click Attach to Process to open the Attach To Process dialog box. In the Available Process section at the bottom of the dialog box, you'll select the instance of IExplore.exe you want to debug. If you leave the Attach To options set to Automatic, Visual Studio will assume that you want to debug script. After you click the Attach button, the Script Explorer window should appear. If it does not, on the Debug menu, click Windows, and then select Script Explorer. Double-click the script item in the Script Explorer window. The source opens, and now you can set breakpoints. If you have to support a traditional ASP application, sometimes referred to as ASP.OLD, you're in luck with Visual Studio 2005. There's sufficient support in the script-debugging portion to make it relatively easy. All the steps are listed at http://msdn.microsoft.com/library/default.asp?url=/library/en-us/vsdebug/html/vxtskaspscriptdebugging.asp?frame=true. It's a little convoluted to set up, but it keeps you from installing an older version of Visual Studio just for ASP.OLD debugging. For Windows Script Host (WSH) files and stand-alone .js and .vbs files, the JavaScript debugger or VBScript Stop keywords will break into the debugger. You can also start both wscript.exe and cscript.exe with the //X command-line option to trigger the script debugger so you can debug from the first executable line of script code. How can I debug with a different Code Access Security (CAS) level?Although you can debug across Windows accounts by starting the program in one account and running the debugger from an account with administrator privileges, debugging your code from the IDE running in a partially trusted zone, such as the Internet zone, was impossible until Visual Studio 2005. In .NET 1.1, you had to go to the CAS settings in the .NET Configuration Microsoft Management Console and manually change the process settings. To play with your code in any CAS situation from the Visual Studio 2005 debugger, go into the project properties' Security tab, and then select the Enable ClickOnce Security Settings check box. That will enable you to select the execution zone and grant or deny specific permissions. Figure 4-3 shows where I've set custom CAS settings to deny FileIOPermission for the process. Figure 4-3. Setting the Code Access Security for the debuggee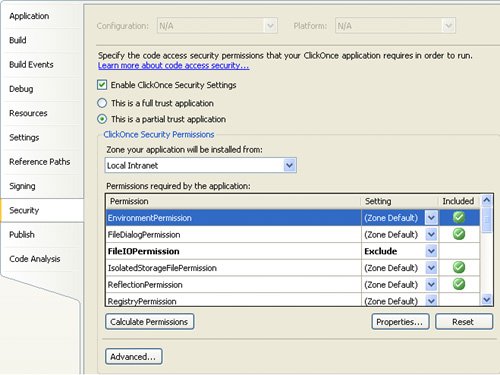 Why do I sometimes get that annoying context switch deadlock exception when stopped in the debugger too long on Windows Forms applications? What are Managed Debugging Assistants?Even though my friend Don Box likes to say, "Windows is the device driver," it's not quite to that point yet. We all have legacy C DLLs and COM/COM+ objects that we still need to use in our development. (By the way, am I the only one who thinks it odd that the COM specification reached only version 0.9? Does that mean that COM never made it to 1.0? Microsoft no longer has the COM Specification document posted, but see http://www.sei.cmu.edu/str/descriptions/com_body.html for the version number.) When Microsoft was planning .NET 2.0, they looked at all the areas where developers were having trouble in their .NET applications, and PInvoking to both C DLLs and COM/COM+ components was at the top of the list. To rectify that, they added a very nice feature to the CLR runtime called Managed Debugging Assistants (MDAs), which do extra checking on that PInvoke boundary to ensure that you're not inadvertently causing yourself a major problem. A perfect example of a seriously nasty problem to debug is if you pass a delegate to native code in order for the native code to be able to call back into your managed code. If, on the managed side, you release all references to the delegate, the delegate is eligible for garbage collection. However, the native code knows nothing about the garbage collector, so it's holding onto the delegate to call it when necessary. You can probably guess that what's going to happen is that a garbage collection is going to occur and clean up the actual delegate, and later, the native code will call the delegate, and you'll crash spectacularly. There are 42 MDAs to assist you, although some are for logging purposes. You can read all about the MDAs at http://msdn2.microsoft.com/en-us/library/d21c150d.aspx. Additionally, Steve Toub wrote an excellent article on using them at http://msdn.microsoft.com/msdnmag/issues/06/05/BugBash/. The one thing I do want to specifically address is why some MDA errors cause you to stop in the debugger. In the Exception dialog box, accessible from the Debug menu, if you expand the Managed Debugging Assistants node, you'll see that some items are selected by default, such as Call-backOnCollectedDelegate and ContextSwitchDeadlock. When running under a debugger, those selected MDAs cause the CLR to break into the debugger when one of those items triggers. Because the ContextSwitchDeadlock MDA is selected by default, you probably have seen the error when you have stopped in the debugger for longer than 60 seconds. Technically, the error reported by the ContextSwitchDeadlock MDA is a bug, but I wish it weren't. Because Microsoft obviously put so much work into the MDA architecture, and MDA reports such good bugs, I like to occasionally run my applications with all MDA options selected when under the debugger. That way I get the best checking possible. You can also turn on all the MDA checking when running outside the debugger by setting an environment variable, COMPLUS_MDA. You can also turn on MDA checking with a registry key, but that is global to all processes, and it's better to set only the environment variable for specific processes. If you set the COMPLUS_MDA to 1, the runtime will look for a file called AppName.exe.mda.config and read the settings you want for that program. The following shows an example file that turns on several interesting MDAs. I've discussed CallbackOnCollectedDelegate already. LoadFromContext tells you when the code calls Assembly.LoadFrom, which can lead to problems in serialization, casting, and dependency resolution because Assembly.LoadFrom does less proper checking than Assembly.Load. PInvokeStackImbalance checks that the native methods you are calling are properly declared and do not corrupt the stack. Finally, StreamWriterBufferDataLost looks for the case in which a Stream object is being garbage collected before you have closed the stream. Even though all the MDA names start with an upper case letter, you specify them in AppName.exe.mda.config with an initial lower case: <?xml version="1.0" encoding="UTF-8" ?> <mdaConfig> <assistants> <callbackOnCollectedDelegate /> <loadFromContext /> <pInvokeStackImbalance /> <streamWriterBufferedDataLost /> </assistants> </mdaConfig> So you don't have to hand-write a configuration file every time, you can also set the COMPLUS_MDA environment variable to the MDA values you want to use. The following shows how to turn on the first two MDAs from the previous configuration file: set COMPLUS_MDA=callbackOnCollectedDelegate;loadFromContext Because the MDA checking is so important, I put a batch file in the code .\MDA\Ultimate-MDAEnv.CMD, which turns on all the error-checking MDA values. Now you can have your test environments running with a higher level of checking to find those errors before your customers do. What's even better is that the MDA settings work with your release build code so you could use them to monitor production systems if you absolutely had to.
|
EAN: 2147483647
Pages: 99