Debugging Situations
|
Now that you have an idea of what WinDBG can do and how to avoid some of the issues it presents, I want to turn to various debugging situations you'll encounter and explain how to tackle them using the Command window. The Command window is the root of everything in WinDBG, and although it's harder to learn than using a UI, you can debug much faster once you get familiar with the commands. It all comes down to how much effort you want to put in.
Before we jump into the various commands, I need to mention a couple of issues related to commands. The first is just to remind you that pressing Alt+1 will bring the Command window front and center when debugging. The second is the syntax to calculate addresses because so many commands rely on them. The primary way to specify a particular address based on a symbol is to use the module!symbol format, in which the module and symbol comparison is case-insensitive. For example, to get the address of LoadLibraryW, the syntax is kernel32!LoadLibraryW. To specify an address based on a source and line, the syntax is `[[module!]filename][:linenumber]`. Pay careful attention to the delimiters; they are grave accents (`). The module and filename are optional. If you omit the module (`foo.cpp:23`), WinDBG will look through the symbols for all loaded modules. Omitting the filename (`:23`) will assume the filename based on the current executing instruction.
WinDBG has three types of commands: regular commands, meta commands (also called dot commands), and extension commands. These commands are generally described in the following ways. Regular commands control the debuggee. For example, tracing, stepping, and viewing memory are regular commands. Meta commands mostly control the debugger and the act of debugging. For example, creating log files, attaching to processes, and writing dump files are meta commands. Extension commands are where the action is, as they are commands that dig into the debuggee and perform analysis on situations or states. Examples of extension commands include handle dumping, critical section analysis, and crash analysis.
Getting Help
When you're staring at the blinking cursor in the bottom of the Command window wondering what command you'll need, you need to turn to the help. If you just need a tip on what a regular command name is or what its syntax is, the ? (Command Help) command will bring up a couple of pages of listings so that you can see information about the various regular commands. Some of the regular commands do support passing -? as a parameter, so you can get quick help on their parameters. You'll have to use trial and error to find out which ones support -?. For meta commands, use .help (Meta-command Help) to see the quick listing. Because help for the extension commands is on a case-by-case basis and the syntax is a little different, I'll describe help for those in the "Magical Extensions" section later in this chapter. Also, for regular and meta commands, the commands are case-insensitive, but for extension commands, the commands are all lowercase.
Probably the most important command is the .hh (Open HTML Help File) meta command. Passing any command type as a parameter to .hh will open the DEBUGGER.CHM help file to the Index tab with the specified command highlighted. Simply press Enter to see the help information for that command. I hope that in a future version of WinDBG, the development team will fix the .hh command so that it opens to the help topic of the specified command automatically.
When looking at the command help in DEBUGGER.CHM, pay careful attention to the Environment section that appears with each command. The table in that section tells you the situations in which WinDBG can run the command. Obviously, for user-mode debugging, the Modes field will need to identify user mode. Nearly all the user-mode commands work during live debugging as well as while looking at minidumps.
One thing that's not very clear in the help for any of the commands is why there is a complete lack of consistency when it comes to parameters you can pass to commands. Some commands take parameters that must be delimited by a dash, some take parameters that must be delimited by a slash, and others take parameters that have no delimiters at all. Pay close attention to the documentation for how to specify parameters for any given command.
Ensuring Correct Symbols Are Loaded
WinDBG excels at symbol handling. Whereas Visual Studio .NET gives you no chance to see exactly what's loaded, WinDBG shows you everything. When I'm doing native debugging, I use WinDBG to ensure I have all my symbols aligned before moving over to the ease of Visual Studio .NET. That way I know exactly where I stand and don't have the surprise of stepping through comments or having an operating system symbol point into never-never land.
The most important feature of WinDBG's symbol handling is that you can force all symbols to reload at any time. At the bottom of the Symbol Search Path dialog box is the Reload check box. After you change the symbol path, checking Reload and clicking the OK button will make WinDBG unload any loaded symbols and reload them based on the new symbol path. This is an incredibly powerful feature to allow you to get the best symbols possible. There are also commands to reload symbols, but first I need to show how you can determine what symbols you have loaded.
Whenever the Command window is active, the LM (List Loaded Modules) command will display the list of modules and their corresponding symbol files. As an example, I loaded the ![]() ASSERTTEST.EXE program (available with this book's sample files), the program to help test SUPERASSERT, into WinDBG. With WinDBG stopped at the loader breakpoint, issuing the LM command shows the following output:
ASSERTTEST.EXE program (available with this book's sample files), the program to help test SUPERASSERT, into WinDBG. With WinDBG stopped at the loader breakpoint, issuing the LM command shows the following output:
0:000> lm start end module name 00400000 0040a000 AssertTest (deferred) 10200000 10287000 MSVCR71D (deferred) 10480000 1053c000 MSVCP71D (deferred) 60000000 6004a000 BugslayerUtil (deferred) 6d510000 6d58d000 dbghelp (deferred) 70a70000 70ad4000 SHLWAPI (deferred) 71950000 71a34000 COMCTL32 (deferred) 77c00000 77c07000 VERSION (deferred) 77c10000 77c63000 msvcrt (deferred) 77c70000 77cb0000 GDI32 (deferred) 77d40000 77dc6000 USER32 (deferred) 77dd0000 77e5d000 ADVAPI32 (deferred) 77e60000 77f46000 kernel32 (deferred) 77f50000 77ff7000 ntdll (pdb symbols) \\zeno\WebSymbols\ntdll.pdb\3D6DE29B2\ntdll.pdb 78000000 78086000 RPCRT4 (deferred)
Since loading symbols takes up huge amounts of memory, WinDBG uses lazy symbol loading so that it loads the symbols only when needed. Since WinDBG's original mission is to debug the entire operating system (OS), loading all the OS symbols when it first attaches through kernel debugging would make WinDBG unusable. Thus, the output just shown reveals that the only symbols I have loaded are those for NTDLL.DLL. The rest are marked as "(deferred)" because WinDBG didn't have a reason to access them. If I pulled up a source file in ![]() ASSERTTEST.EXE and pressed F9 to set a breakpoint on the line, WinDBG would start loading these symbols until it found one that contained the source file. That's the reason for the message box that prompts you to load symbols. However, at the command-line level, you have finer grained control for choosing which symbols to load.
ASSERTTEST.EXE and pressed F9 to set a breakpoint on the line, WinDBG would start loading these symbols until it found one that contained the source file. That's the reason for the message box that prompts you to load symbols. However, at the command-line level, you have finer grained control for choosing which symbols to load.
To force a symbol load, the LD (Load Symbols) command does the trick. LD takes only a module name on the command line, so to force the loading of symbols for ![]() ASSERTTEST.EXE, I'd issue ld asserttest and get the following output:
ASSERTTEST.EXE, I'd issue ld asserttest and get the following output:
0:000> ld asserttest *** WARNING: Unable to verify checksum for AssertTest.exe Symbols loaded for AssertTest
WinDBG is very particular about symbols and tells you about anything that could potentially be wrong with the symbols. Since I'm using a debug build of ![]() ASSERTTEST.EXE, I didn't have the /RELEASE switch turned on when I linked the program because it turns off incremental linking. As I mentioned in Chapter 2, the /RELEASE switch is misnamed, and it really should be /CHECKSUM because all it does is add the checksum to the binary and the PDB file.
ASSERTTEST.EXE, I didn't have the /RELEASE switch turned on when I linked the program because it turns off incremental linking. As I mentioned in Chapter 2, the /RELEASE switch is misnamed, and it really should be /CHECKSUM because all it does is add the checksum to the binary and the PDB file.
To force all symbol loading, specify the wildcard character as this LD parameter: ld *. As you poke through the WinDBG documentation, you'll see another command, .RELOAD (Reload Module), which essentially does the same thing as LD. To load all symbols with .RELOAD, use the /f parameter: .RELOAD /f. If you're debugging on a large program, the .RELOAD command might be a little better to use because it will report only those modules that have symbol problems, whereas LD will show the result of every module load. Either way, you'll know immediately which symbols aren't correct.
You can also verify proper symbol loading through the LM command. After forcing all symbols to load, the output of the LM command shows the following. (I folded the last item on each line to fit the width of the page.)
0:000> lm start end module name 00400000 0040a000 AssertTest C (pdb symbols) D:\Dev\BookTwo\Disk\Output\AssertTest.pdb 10200000 10287000 MSVCR71D (pdb symbols) e:\winnt\system32\msvcr71d.pdb 10480000 1053c000 MSVCP71D (pdb symbols) e:\winnt\system32\msvcp71d.pdb 60000000 6004a000 BugslayerUtil C (pdb symbols) D:\Dev\BookTwo\Disk\Output\BugslayerUtil.pdb 6d510000 6d58d000 dbghelp (pdb symbols) \\zeno\WebSymbols\dbghelp.pdb\ 819C4FBAB64844F3B86D0AEEDDCE632A1\dbghelp.pdb 70a70000 70ad4000 SHLWAPI (pdb symbols) \\zeno\WebSymbols\shlwapi.pdb\3D6DE26F2\shlwapi.pdb 71950000 71a34000 COMCTL32 (pdb symbols) \\zeno\WebSymbols\MicrosoftWindowsCommon-Controls- 60100-comctl32.pdb\3D6DD9A81\ MicrosoftWindowsCommon-Controls- 60100-comctl32.pdb 77c00000 77c07000 VERSION (pdb symbols) e:\winnt\symbols\dll\version.pdb 77c10000 77c63000 msvcrt (pdb symbols) \\zeno\WebSymbols\msvcrt.pdb\3D6DD5921\msvcrt.pdb 77c70000 77cb0000 GDI32 (pdb symbols) \\zeno\WebSymbols\gdi32.pdb\3D6DE59F2\gdi32.pdb 77d40000 77dc6000 USER32 (pdb symbols) \\zeno\WebSymbols\user32.pdb\3DB6D4ED1\user32.pdb 77dd0000 77e5d000 ADVAPI32 (pdb symbols) \\zeno\WebSymbols\advapi32.pdb\3D6DE4CE2\advapi32.pdb 77e60000 77f46000 kernel32 (pdb symbols) \\zeno\WebSymbols\kernel32.pdb\3D6DE6162\kernel32.pdb 77f50000 77ff7000 ntdll (pdb symbols) \\zeno\WebSymbols\ntdll.pdb\3D6DE29B2\ntdll.pdb 78000000 78086000 RPCRT4 (pdb symbols) \\zeno\WebSymbols\rpcrt4.pdb\3D6DE2F92\rpcrt4.pdb
Those module names followed by a "C" indicate symbols that don't have the checksums set in the module or in the symbol file. An octothorpe "#" following a module indicates symbols that don't match between the symbol file and the executable. (Yes, WinDBG will load the closest symbols, even if they're not correct.) In the preceding example, life is good and all the symbols match. However, you'll normally see the octothorpe next to COMCTL32.DLL. Because it seemingly changes with every single Microsoft Internet Explorer security patch, the odds of getting correct symbols with COMCTL32.DLL are almost nonexistent. To get more detailed information about which modules and corresponding symbol files are loaded, pass the v option to LM. To show a single module in the next example, I used the m option to match a specific module.
0:000> lm v m gdi32 start end module name 77c70000 77cb0000 GDI32 (pdb symbols) \\zeno\WebSymbols\ gdi32.pdb\3D6DE59F2\gdi32.pdb Loaded symbol image file: E:\WINNT\system32\GDI32.dll Image path: E:\WINNT\system32\GDI32.dll Timestamp: Thu Aug 29 06:40:39 2002 (3D6DFA27) Checksum: 0004285C File version: 5.1.2600.1106 Product version: 5.1.2600.1106 File flags: 0 (Mask 3F) File OS: 40004 NT Win32 File type: 2.0 Dll File date: 00000000.00000000 CompanyName: Microsoft Corporation ProductName: Microsoft Windows Operating System InternalName: gdi32 OriginalFilename: gdi32 ProductVersion: 5.1.2600.1106 FileVersion: 5.1.2600.1106 (xpsp1.020828-1920) FileDescription: GDI Client DLL LegalCopyright: Microsoft Corporation. All rights reserved.
To see exactly where WinDBG is loading symbols and why, the extension command !sym from ![]() DBGHELP.DLL offers the noisy option. The output in the Command windows shows you exactly what process the WinDBG symbol engine goes through to find and load the symbols. Armed with the output, you should be able to solve any possible symbol-loading problem you'll encounter. To turn off the noisy output, issue the !sym quiet command.
DBGHELP.DLL offers the noisy option. The output in the Command windows shows you exactly what process the WinDBG symbol engine goes through to find and load the symbols. Armed with the output, you should be able to solve any possible symbol-loading problem you'll encounter. To turn off the noisy output, issue the !sym quiet command.
The final point I want to make about symbols is that WinDBG has built-in symbol browsing. The X (Examine Symbols) command allows you to look at symbols globally, specific to a module, or in the local context. Using the module!symbol format, you should have no trouble tracking down where a symbol is stored. Additionally, the X command is case-insensitive to make life even easier. To see the address where LoadLibraryW is in memory, the command and output is the following:
0:000> x kernel32!LoadLibraryw 77e8a379 KERNEL32!LoadLibraryW
The module!symbol format supports wildcards, so, for example, if you want to see anything in KERNEL32.DLL with "lib" in the symbol name, x kernel32!*Lib* works great and is also case-insensitive. To see all the symbols in a module, use a single wildcard in place of the symbol name. Using only a wildcard as the parameter will show the local variables in the current scope, which is identical to the DV (Display Variables) command I'll discuss later in the chapter in the section "Looking at and Evaluating Variables."
Processes and Threads
With the symbol story behind us, I can now turn to the various means of getting processes running under WinDBG. Like Visual Studio .NET, WinDBG can debug any number of disparate processes at a time. What makes WinDBG a little more interesting is that you have better control over debugging processes spawned from a process being debugged.
Debugging Child Processes
If you look back at the Open Executable dialog box in Figure 8-2, you'll notice that the very bottom of the dialog box has a check box titled Debug Child Processes Also. By checking it, you're telling WinDBG that you also want to debug any processes started by debuggees. When running Microsoft Windows XP or Microsoft Windows Server 2003, if you forget to check that box when opening a process you can use the .CHILDDBG (Debug Child Processes) command to change the option on the fly. By itself, .CHILDDBG will tell you the current state. Issuing a .CHILDDBG 1 command will turn on debugging child processes. Issue .CHILDDBG 0 to turn it off.
To show you some of the multiple process and thread options, in the next section I'll provide some of the output resulting from debugging the command prompt, CMD.EXE, and choosing to debug child processes as well. After I get CMD.EXE loaded up and executing, I'll start NOTEPAD.EXE. If you follow the same steps and have child debugging enabled, as soon as you start NOTEPAD.EXE, WinDBG will stop at the loader breakpoint for NOTEPAD.EXE. It makes sense that WinDBG stopped NOTEPAD.EXE, but that also stops CMD.EXE because both processes are now sharing the debugger loop.
To see in the UI the processes that are currently running, choose Processes And Threads from the View menu. You'll see a layout similar to that in Figure 8-3. In the Processes And Threads window, the processes are all the root nodes, with each processes' threads as their children. The numbers next to CMD.EXE, 000:9AC, are the WinDBG process number followed by the Win32 process ID. In CMD.EXE, the thread 000:9B0 indicates the WinDBG thread ID and the Win32 thread ID. The WinDBG process and thread numbers are unique the entire time WinDBG is running. That means there can never be another process number 1 until I restart WinDBG. The WinDBG process and thread numbers are important because they are used to set per-process and per-thread breakpoints and can be used as modifiers to various commands.
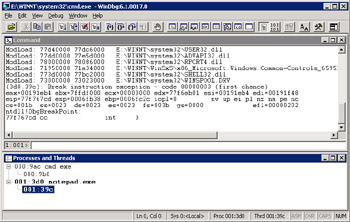
Figure 8-3: The Processes And Threads window
Viewing Processes and Threads in the Command Window
As with anything in WinDBG, if WinDBG displays it in a window, there's a Command window command to get at the same information. To view the processes being debugged, the | (Process Status) command does the trick. The output for the two processes shown in Figure 8-3 is as follows:
1:001> | 0 id: 9ac create name: cmd.exe . 1 id: 3d0 child name: notepad.exe
The dot in the far left column indicates the active process, meaning that any commands you execute will be working on that process. The other interesting field is the one that tells how the process came to run under the debugger. "Create" means WinDBG created the process, and "child" indicates a process that was spawned by a parent process.
The overloaded S command—|S for Set Current Process and ~S for Set Current Thread—does the work to change which process is active. You can also use the Processes And Threads window and double-click on the process you'd like to make active. The bold font indicates the active process. When using the S command, you need to specify the process as a prefix to the command. For example, to switch from the second process to the first, you'd issue |0s. To quickly see which process is active, look at the numbers to the left of the Command window input line. As you swap between the processes, you'll see the numbers update. When I switched to the first process using the CMD.EXE and NOTEPAD.EXE examples and issued the | command again, the output looked a little different:
0:000> | . 0 id: 9ac create name: cmd.exe # 1 id: 3d0 child name: notepad.exe
The difference is the octothorpe in front of the NOTEPAD.EXE process. The octothorpe indicates the process that caused the exception to stop in WinDBG. Since NOTEPAD.EXE is sitting at its loader breakpoint, the exception was a breakpoint.
Viewing threads is almost identical to viewing processes. I'm going to let NOTEPAD.EXE start, so I'll press F5 in WinDBG. When NOTEPAD.EXE appears, I'll open the File Open dialog box because it creates a bunch of threads, and in WinDBG I'll press Ctrl+Break to break into the debugger. If you do the same and have the Processes And Threads window open, you should see that NOTEPAD.EXE has four threads in it and CMD.EXE has two threads.
The ~ (Thread Status) command shows the active threads in the current process. Switching to the NOTEPAD.EXE process and issuing the ~ command creates the following output on Windows XP (SP1):
1:001> ~ . 1 Id: 3d0.39c Suspend: 1 Teb: 7ffde000 Unfrozen 2 Id: 3d0.1a4 Suspend: 1 Teb: 7ffdd000 Unfrozen 3 Id: 3d0.8f0 Suspend: 1 Teb: 7ffdc000 Unfrozen 4 Id: 3d0.950 Suspend: 1 Teb: 7ffdb000 Unfrozen
As with the | command, the ~ command uses a dot to indicate the current thread and an octothorpe to signify the thread that either caused the exception or was active when the debugger attached. The WinDBG thread number is the next displayed item. As with process numbers, there will only ever be one thread number 2 for the life of the WinDBG instance. Next come the ID values, which are the Win32 process ID followed by the thread ID. The suspend count is a little confusing. A suspend count of 1 indicates the thread is NOT suspended. The help on ~ shows a suspend count of 0, which I've never seen in the output. After the suspend count is the linear address of the Thread Environment Block (TEB) for the thread. The TEB is the same thing as the Thread Information Block (TIB) I discussed in Chapter 7 and is the address of the per-thread data block that contains the thread instance information such as the stack and COM initialization. Finally, Unfrozen indicates whether you've used the ~F (Freeze Thread) command to freeze a thread. (Freezing a thread from the debugger is akin to calling SuspendThread on that thread from your program. You'll stop that thread from executing until it is unfrozen.)
A command will work on the current thread by default, but sometimes you'll want to see information about a different thread. For example, to see the registers of a different thread, you use the thread modifier in front of the R (Registers) command: ~2r. If you have multiple processes open, you can also apply the process modifier to the commands. The command |0~0r shows the registers for the first process and first thread no matter which process and thread are active.
Creating Processes from the Command Window
Now that you're armed with the ability to view processes and threads, I can move into some of the more advanced tricks you can perform to get processes started under WinDBG. The .CREATE (Create Process) command lets you start up any arbitrary processes on the machine. This is extremely helpful when you need to debug multiple sides of a COM+ or other cross-process application. The main parameters to .CREATE are the complete path to the process to start and any command-line parameters to that process. As when you start any processes, it's best to put the path and process name in quotation marks to avoid issues with spaces. The following shows using the .CREATE command to start Solitaire on one of my development machines:
.create "e:\winnt\system32\sol.exe"
After pressing Enter, WinDBG indicates that the process will be created on the next execution. What that means is that WinDBG must allow the debugger loop to spin over in order to handle the process creation notification. WinDBG has already made the CreateProcess call, but the debugger hasn't seen it yet. By pressing F5, you will release the debug loop. The create process notification comes through and WinDBG will stop on the loader breakpoint. If you use the | command to view the processes, WinDBG shows any processes started with .CREATE marked as "create," as if you started the session with that process.
Attaching to and Detaching from Processes
If a process is already running on the machine and you want to debug it, the .ATTACH (Attach to Process) command does the trick. In this section I'll discuss the full debugging attach. In the next section, I'll discuss the noninvasive attach in which the process does not run under a debugger loop.
The .ATTACH command requires the process ID in order to perform the attach. If you have physical access to the machine the process is running on, you can look up the process ID with Task Manager, but for remote debugging, that's a little hard to do. Fortunately, the WinDBG developers thought of everything and added the .TLIST (List Process IDs) command to list the running processes on the machine. If you're debugging Win32 services, use the –v parameter to .TLIST to see which services are running in which processes. The output of the .TLIST command looks like the following:
0n1544 e:\winnt\system32\sol.exe 0n1436 E:\Program Files\Windows NT\Pinball\pinball.exe 0n2120 E:\WINNT\system32\winmine.exe
When I first saw the output, I thought there was a bug in the command and somebody accidentally typed "0n" instead of "0x." However, I've since learned that 0n as a prefix is the ANSI standard for decimal in the same way 0x is for hexadecimal.
Once you have the decimal process ID for the process, you'll pass it as the parameter to .ATTACH (ensuring you use the 0n prefix or it won't work). Like when creating processes, WinDBG will say something about the attach occurring on the next execution, so you'll need to press F5 to let the debugger loop spin. From that point on, you're debugging the process you attached to. The only difference is that the | command will report the process as "attach" in its output.
If you're debugging on Windows XP or Windows Server 2003, you have the .DETACH (Detach from Process) command available to allow debuggees the ability to run free once again. As it only works on the current process, you'll need to switch to the process you want to detach from before you execute the .DETACH command. At any point, you can re-attach to the process to do full debugging.
If you simply want to attach to a process right after starting WinDBG, when it does not have a Command window open, either press F6 or select Attach To A Process from the File menu. In the subsequent Attach To Process dialog box, you can expand the nodes in the tree to view the command lines for the processes. If the process happens to contain Win32 services, you'll see those as well. After selecting the process, click OK and you're debugging away.
Noninvasive Attaching
The full attach I just described is great because you have full access to all the debugging options such as breakpoints. However, on Microsoft Windows 2000, once the process is running under the debugger, it's running under it for life. That's not always the best option when you're attempting to debug production servers, because you must always leave someone with full administrator rights logged on to that server so that WinDBG can run—not to mention that running under a debugger slows down the process. Fortunately, Microsoft finally added in Windows XP and Windows Server 2003 the ability to detach from debugging processes (something I know I asked for back in the Microsoft Windows 3.1 days!).
To make Windows 2000 production debugging a little bit easier, WinDBG offers the noninvasive attach. WinDBG suspends the process so that you can examine it with many commands, but you can't do normal debugging tasks such as set breakpoints. This is a decent trade-off in that you can see a lot of useful information like handle states while still allowing the process to run at full speed later.
Probably the best way to do noninvasive debugging is from a dedicated instance of WinDBG. As you'll see in a moment, to continue the process, which resumes all the threads, you need to close the workspace. If you're already debugging processes, WinDBG will have to immediately shut down those processes. In the bottom of the Attach To Process dialog box, shown in Figure 8-4, make sure the first thing you do is check the Noninvasive check box before you select the process to debug. That way you won't accidentally fall into full debugging.
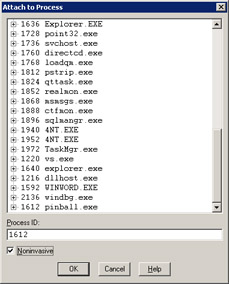
Figure 8-4: Getting ready to do noninvasive debugging
After you click OK, WinDBG will look like it's cranking up to do regular debugging. However, the warning near the top of the Command window, shown here, will help you remember what you're doing:
WARNING: Process 1612 is not attached as a debuggee The process can be examined but debug events will not be received
Once attached, you can examine the process all you want. When finished examining, you'll need to release the processes so that it can continue running. The best way to release the debuggee is by issuing the Q (Quit) command. This will close the workspace and leave WinDBG running so that you can attach again. If you use the .DETACH command, which does work, you have to shut down WinDBG because there's no way to reattach with that instance.
|
EAN: 2147483647
Pages: 177