The Basics
|
The biggest problem people face when dealing with WinDBG is getting it set up and wading through a ton of spewed output. I want to turn to a few issues that will help you get past some of those hurdles so that you don't have to bear the scars of learning them. Finally, I'll cover some of the odd quirks of WinDBG so that they won't surprise you and leave you scratching you head wondering what went wrong.
The big thing to remember about WinDBG is that it's kind of a retro debugger. (Heck, the console-based NTSD.EXE should bring tears to some old-timer's eyes!) To that end, it doesn't help you much. Whereas Visual Studio .NET will assist you when it comes to finding symbols and source code, you have to tell WinDBG exactly where to look to find things. If you're debugging a program built on the same machine you're debugging on, the Microsoft Visual C++ .NET compiler and linker embed the complete path to symbols and, inside the PDB, the path to any source files so that you won't have any problems. However, getting the symbols and source lined up if you didn't build the binaries on your debugging machine takes a little doing.
Back in Chapter 2, I introduced the symbol server technology, and without a doubt, it's one of the most important advances in Windows debugging in years. You should have your own symbol server set up by now and be using the _NT_SYMBOL_PATH environment variable so that Visual Studio .NET will use the symbol server. WinDBG will automatically pick the _NT_SYMBOL_PATH environment variable as the base symbol path to use. WinDBG uses workspaces to store specific information about each process you debug, such as breakpoints, window layout, and symbol paths. Just starting WinDBG before opening a process allows you to change the settings of the base workspace from which all others will inherit their settings. You'll know you're in the base workspace because no MDI child windows are open in the WinDBG frame. By getting the base workspace set with the common values you need across all processes, you'll save yourself a tremendous amount of hassle.
After setting the _NT_SYMBOL_PATH environment variable, you'll need to tell WinDBG where to find common source files. Although you can set the source file paths through an environment variable, _NT_SOURCE_PATH (see the DEBUGGER.CHM file for all the details), there's an easier way. With the base workspace open in WinDBG, click on the File, Source File Path menu to open the Source Search Path dialog box in which you can enter the paths to common source file locations. At a minimum, you'll always want your default location to look for the C run time and MFC/ATL source code, so you should enter something like the following paths. Note that I separated all the individual paths so that you could see them more easily, but you should enter the values on one line.
<Visual Studio .NET Installation Dir>\vc7\crt\src; <Visual Studio .NET Installation Dir>\vc7\crt\src\intel; <Visual Studio .NET Installation Dir>\vc7\atlmfc\include; <Visual Studio .NET Installation Dir>\vc7\atlmfc\src\mfc; <Visual Studio .NET Installation Dir>\vc7\atlmfc\src\atl; <Visual Studio .NET Installation Dir>\vc7\atlmfc\src\atl\atls; <Visual Studio .NET Installation Dir>\vc7\atlmfc\src\atl\atlmincrt;
You can separate multiple directories with semicolons just as you can with normal paths. If you really have a burning desire to use NTSD, set the environment variable _NT_SOURCE_PATH to the same value.
The final path you'll want to set is the executable image path, which is what WinDBG uses to find binary files. If you're doing live debugging, WinDBG will automatically find the files and load them. However, if you're going to be debugging minidumps, which WinDBG excels at, you'll need to tell WinDBG where it's supposed to look for the binaries. If you followed my recommendations in Chapter 2 when setting up your symbol engine, you put both the operating system and your product symbols and binaries into your symbol server. You can set the executable path for the base workspace by selecting File, Image File Path and entering the same string that you're using for your symbol path or the _NT_SYMBOL_PATH environment variable. WinDBG is smart enough to properly handle getting the binaries on your minidumps directly from your symbol server.
The fact that WinDBG can handle minidumps no matter whether they come from a customer or your manager's machine makes is a key reason you need to spend time with WinDBG. Even if you set the environment variable _NT_EXECUTABLE_IMAGE_PATH to tell Visual Studio .NET where it can find the executables, Visual Studio .NET doesn't load them. Since minidumps are so important for finding problems in production environments, WinDBG is vital to your bug squashing.
After you start opening processes to debug live or minidumps to view, you can update each of those workspaces with symbol, source, and binary paths unique to each project. Every time you change anything on a workspace, which includes set breakpoints; symbol, source, and binary paths; and window layout, WinDBG prompts you to save the workspace whenever the workspace is about to close. It's probably in your best interest to always save the workspace. You can delete unused workspaces or clear specific items saved with a workspace by selecting any of the workspace management items from the File menu.
Finally, you'll want to set in the default workspace some of the color options so that you can see important information in the Command window. If you've never run WinDBG before, you'll notice that WinDBG is verbose to the extreme. Everything goes to the Command window, and you can easily lose track of anything important. Simply loading a large process can result in over 100 lines of spew! Fortunately, WinDBG now allows you to color various reasons for the spew so that you can separate the wheat from the chaff. The color selections appear at the bottom of the Options dialog box, which you can access by selecting Options from the View menu.
The bad news is that the meaning of all the various color items is not quite documented. Some of the items you can color, such as Enabled Breakpoint Background, are self-explanatory, but others, such as Error Level Command Window Text, only appear to be self-explanatory—I never have seen my chosen color. In reality, the most important highlighting you'll want is on any TRACE or OutputDebugString calls that your programs make. You can get these important values displayed in a different color by setting Debuggee Level Command Window Text to a different color. I personally always choose green as that indicates goodness.
To save your blood pressure, I want to mention a few weird behaviors WinDBG exhibits and how you can work around them. The first piece of very weird behavior concerns what happens when your process ends. In Visual Studio .NET, when your process ends, pressing F5 will restart debugging. With WinDBG, one of two things happens. If you open the process by selecting Open Executable from the File menu, pressing F5 will probably prompt you to save the workspace. After you click a button in the prompt message box, the workspace magically closes, and you're looking at WinDBG with no workspace open. If you happen to start WinDBG with the program to debug on the command line, pressing F5 after the process ends again prompts you to save the workspace. This time, after the prompt goes away, so does WinDBG! Yes, it's completely counterintuitive, but that's how WinDBG works. If you want to restart debugging, select Restart from the Debug menu or press Ctrl+Shift+F5.
Finally, WinDBG is extremely anal-retentive about window placement. It wants to put the child window where it thinks best whether you like it or not! If you're tired of seeing the message box each time you attempt to move a child window, uncheck the Auto-Arrange item on the Window menu. Even though WinDBG is a little rough around the edges, I forgive it because of the power it brings to debugging.
Before I jump into the Command window, I strongly suggest you use WinDBG as a normal GUI debugger for a day or so. It allows normal source-level debugging, so you can open a source file, put the cursor on a line, and press F9 to set a breakpoint. As WinDBG does not load symbol files until needed, you'll probably see a message box prompting you about loading symbols. Always click Yes and you should be fine. I'll talk more about symbol loading issues later in this chapter. In addition to Source windows, the View menu lists all the different types of windows available. WinDBG has the full complement of debugger windows such as Registers, Memory, and Locals. Interestingly, WinDBG also has a Scratch Pad window if you're too lazy to press Alt+Tab to access Notepad to paste debugging information or take notes. As you'll see when you start using WinDBG, the tool certainly doesn't have the UI polish of Visual Studio .NET, but it's certainly serviceable.
Unfortunately, you can't. After you have opened a process, the only way to run the debuggee again with different command-line arguments is to close the workspace and either reopen the process with a new arguments in the Open Executable dialog box or restart WinDBG with new arguments.
You can set the command-line arguments to your process in one of two ways. The first is in the Open Executable dialog box when you choose to open an executable from the File menu. Figure 8-2 shows the Open Executable dialog box; the highlighted area shows the spot where you type the command-line arguments to the debuggee.
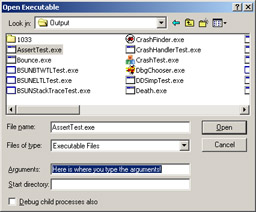
Figure 8-2: The WinDBG Open Executable dialog box
The other option for setting the command-line arguments is to type in the debuggee arguments following the debuggee name on the WinDBG command line.
|
EAN: 2147483647
Pages: 177