Before You Begin
|
Prior to jumping into WinDBG with both feet, I want to go over a few key items to help you get the most out of it. The first is that if you ever have an inkling that you might want to consider writing a WinDBG extension, you'll need to ensure you install the SDK included with the Debugging Tools for Windows. The SDK has the necessary header files as well as some examples to show you the ideas behind extensions. When installing, make sure to select Custom installation from the appropriate setup screen. The custom install screen, shown in Figure 8-1, by default has only one item marked as not installed—the SDK itself. Click on the SDK node and select Entire Feature Will Be Installed On Local Hard Drive. The SDK install directory is, appropriately, named SDK and is directly under the main Debugging Tools for Windows directory.
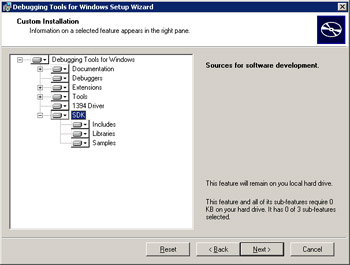
Figure 8-1: SDK installation selected during the Debugging Tools for Windows installation
What makes WinDBG a little weird is that what you and I consider the debugger user interface (UI) isn't where the work takes place at all. The UI is simply a veneer over a debugging engine named DBGENG.DLL. Many people on the operating system teams at Microsoft are used to a debugger named NTSD (Microsoft NT Symbolic Debugger). NTSD is a console application that in the current versions of Debugging Tools for Windows is the console layer over the debugging engine and is part of the Debugging Tools for Windows installation. That means that if you learn to use WinDBG, you can easily use NTSD. Although I prefer the ease of a graphical user interface (GUI), you might want to consider using NTSD because it will scare any roaming managers from sitting in your office and watching over your shoulder as you program. Table 8-1 lists some of the more interesting programs for user-mode developers that are installed as part of Debugging Tools for Windows.
| Programs | Description |
|---|---|
| CDB.EXE | The same debugger as NTSD except it will use the existing command shell when started instead of creating a new one. |
| LOGGER.EXE, LOGVIEWER.EXE | A logging system to log all your API calls, record parameters, and return values so that you can track down operating system interaction issues. |
| LIST.EXE | A console-based text file listing utility. |
| UMDH.EXE | The user-mode heap dumping utility. |
| TLIST.EXE | Lists the currently running processes to a console window. (Make sure you pass the -? option to see the other interesting command-line options for TLIST.EXE.) |
| KILL.EXE | An absolute process killer that will remove any user-mode process from memory. |
| BREAKIN.EXE | Forces a DebugBreak call in the process specified on the command line. |
The biggest improvement to WinDBG, which is a complete rewrite of previous incantations, is not that it does even more to automatically track down recalcitrant bugs, but that the documentation is actually very good. Before you ever start WinDBG, you need to open DEBUGGER.CHM and read it. You have to read several sections in particular because they are excellent discussions of how to solve problems with WinDBG. As you run through the documentation, keep in mind that much of WinDBG's forte is kernel mode debugging, so you can safely skip those sections unless you're going to be doing device driver development. After perusing "Installation and Setup" as well as the user mode portions under "Debugger Operation," as I mentioned in Chapter 2, you need to read the "Symbols" section completely. Under the "Debugging Techniques" section, make sure to read "Elementary Debugging Techniques," "Stack Traces," and "Processor Architecture." As the Command window is everything in WinDBG, spend a good bit of time reading over the "Reference" section, specifically "Debugger Commands" and "Debugger Extension Commands."
You're probably wondering why, if the WinDBG documentation is so good, I even need to write this chapter. The weakness of the documentation is that it assumes you have either a coworker sitting there showing you how to utilize WinDBG or a phone you can pick up to call one of the developers. I don't think that's an intentional slight, but given that Microsoft developed WinDBG with the operating system developers primarily in mind, it's understandable. In this chapter, my goal is to get you up to speed because WinDBG is quite a bit daunting if you've never used it. Additionally, I'll show you some of the tricks WinDBG can do to make debugging much easier.
|
EAN: 2147483647
Pages: 177