Remote Debugging
|
Remote debugging of native applications works almost as seamlessly as remote debugging of managed applications. Simply install the remote debugging components as described in Chapter 6, ensure your account is set up as a member of the remote machine's Administrators group as well as the Debugger Users group, and you can connect and debug all you want through the new DCOM transport layer. This is the perfect way to attach and detach from those long-running server processes.
In addition to the DCOM transport layer, Visual Studio .NET 2003 offers two remote debugging options: Pipes and TCP/IP. The TCP/IP option has been around since Visual C++ 6, but it's not as secure as Pipes. Where TCP/IP remote debugging allows anyone to connect to the machine, the new Pipes allows you to specify exactly which user(s) you'll allow to connect and debug. Pipe debugging is now the default, though it is slower than TCP/IP.
Although not as convenient as DCOM, the Pipes and TCP/IP debugging can be a great tool for certain debugging challenges. One particularly nice new feature is that you can start processes with Pipes and TCP/IP debugging. Additionally, you can set up your Visual Studio .NET solutions to always start the process for remote debugging. This is especially helpful for heavy client-side applications such as DirectX games. A much-needed new feature is the ability to allow multiple connections to the remote machine so that you can debug multiple processes if necessary. Another fine feature is that if you're going to be doing only native debugging, you don't have to go through the complete Remote Components Setup to install just the Pipes and TCP/IP debugging. To get Pipes and TCP/IP debugging set up, you can copy the necessary binaries from a machine that has Visual Studio .NET installed to a directory on the remote machine. Table 7-5 lists the binaries and where you can find them on the Visual Studio .NET machine. Also keep in mind that the Visual C++ 6 version of MSVCMON.EXE cannot be used with Visual Studio .NET.
| File | Copy From Location |
|---|---|
| MSVCR71.DLL | %SYSTEMROOT%\SYSTEM32 |
| MSVCI71.DLL | %SYSTEMROOT%\SYSTEM32 |
| MSVCP71.DLL | %SYSTEMROOT%\SYSTEM32 |
| MSVCMON.EXE | <Visual Studio .NET Installation Dir>\COMMON7\PACKAGES\DEBUGGER |
| NATDBGDM.DLL | <Visual Studio .NET Installation Dir>\COMMON7\PACKAGES\DEBUGGER |
| NATDBGTLNET.DLL | <Visual Studio .NET Installation Dir>\COMMON7\PACKAGES\DEBUGGER |
Before you start remote debugging, it's a very good idea to do a little planning to ensure that your remote debugging session will be successful. The Pipe and TCP/IP version of remote debugging with Visual Studio .NET is much less temperamental than the Visual C++ 6 version. The main trick is ensuring your symbols are locatable by Visual Studio .NET on the local machine, which is where the symbols are loaded. For the operating system symbols, your best bet is to have your symbol server set up as I described in Chapter 2. If you're working on a local build of your product, it's best to have the program you're going to debug installed in the same directories on both the remote and local machines. That way there's no confusion as to where things are supposed to be. Finally, it's an excellent idea to ensure that you can start your program on the remote machine, because nothing's worse than finding out that a DLL is missing right as you start remote debugging.
To start remote debugging with Pipe connections, you'll need to log in on the remote machine and run MSVCMON.EXE. By default, starting MSVCMON.EXE means that you must connect to the remote machine from the machine you're running the Visual Studio .NET IDE on, using the same account that you logged on to on the remote machine. If you're willing to open the remote machine up a little more, you can start MSVCMON.EXE with the -u <domain\group or user> command-line switch to specify which users and groups you're willing to let to the machine to start and debug processes.
Setting up the machine the Visual Studio .NET IDE runs on is pretty simple. It just entails setting a few items in the Debugging property page of the project properties. In the Action section, the Command and Working Directory fields must be filled out with the locations on the remote machine. Optionally, you can specify that you want to attach to the remote process by setting Attach to Yes. The last thing you might want to set in the Action section is the Symbol Path field if you don't have the binaries installed in the same places on both machines.
In the Remote Settings section, set Connection to Remote Via Pipe (Native Only). In the Remote Machine field, enter the name or the IP address of the machine hosting MSVCMON.EXE. You can also try to enter the machine name, but the IP address will always work. It's a good idea to test the connection to the remote machine by using PING.EXE to determine whether you can reach it. If you can reach it through the name of the remote machine, you can use that name, but the IP address will always work. Finally, the Remote Command field must contain the same complete path and name as specified in the Command field in the Action section. Figure 7-6 shows an example project with all the fields filled out.
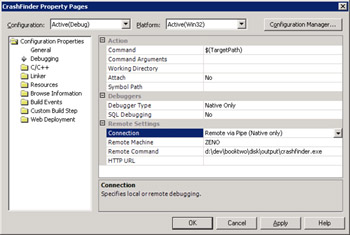
Figure 7-6: A project set up for Pipe debugging
Once the fields are filled in, you know fairly quickly whether you made a good connection. The console window in which MSVCMON.EXE is running will show you the name of the user making the connection, and you'll start debugging as you normally would. If there's a problem, you'll know what you need to do to fix it because Visual Studio .NET error messages are much better than messages in prior releases.
If you're debugging into a machine running terminal server and multiple users could be doing remote Pipes debugging, the MSVCMON.EXE –s <suffix> switch allows you to specify a unique suffix onto the named pipe. Since the first user that starts doing remote Pipe debugging gets the default pipe name, subsequent users debugging into the same machine will need to uniquely identify the instance of MSVCMON.EXE they want to connect to. Once you've started MSVCMON.EXE with the –s option, you'll specify the suffix in the Remote Machine field of the Debugging property page of the project properties dialog, by appending the suffix to the machine name separated with an octothorpe (#). For example, if you run MSVCMON –s pam on the machine ZENO, you'd specify the machine name as ZENO#pam.
As I mentioned earlier, Pipe debugging is slower than TCP/IP debugging, though more secure. If you need the speed, you can turn on TCP/IP debugging with -tcpip command line switch. To tell the solution that you want to use TCP/IP, in the Debugging property page of the project properties dialog, you'll select Remote Via TCP/IP (Native Only) from the Remote Settings Section.
There are a few TCP/IP specific command-line options to MSVCMON.EXE you might be interested in. The first is anyuser, which allows you to let anyone connect to the machine with no security. The second is –maxsessions, which specifies the maximum number of debugging sessions you'll allow at any time. The third option is –timeout, which you can use to tell MSVCMON.EXE how long you're willing to let it wait for a connection before timing out.
|
EAN: 2147483647
Pages: 177