The Watch Window
|
As you've seen through the last two chapters, I really like the Watch window. For native code debugging, the Watch window offers even more power than ever before. One of the improvements you might have already noticed with native debugging in Visual Studio .NET is that the Watch window now automatically knows about HRESULTS, wchar_t (UNICODE characters), and bool types. Additionally, you also might have noticed that the data tips that pop up in the source windows seem to have gotten an extreme dose of steroids.
Formatting Data and Expression Evaluation
The first "trick" you'll need to master on your way to becoming proficient at manipulating the Watch window is memorizing the formatting symbols in Table 7-2 and Table 7-3, which derive from the Visual Studio .NET documentation. The Watch window is wonderfully flexible in how it displays data, and the way you bring out its flexibility is by using the format codes in these tables. As you can see from the tables, the formats are easy to use: follow your variable with a comma and then the format you want to use. The most useful format specifier for COM programming is ,hr. If you keep the expression @EAX,hr in your Watch window, as you step over a COM method call, you can see the results of the call in a form you can understand. (EAX is the Intel CPU register at which return values are stored.) Using the format specifiers allows you to easily control how you see your data so that you can save huge amounts of time interpreting it.
| Symbol | Format Description | Sample | Display |
|---|---|---|---|
| d, i | Signed decimal integer | (int)0xF000F065,d | –268373915 |
| u | Unsigned decimal integer | 0x0065,u | 101 |
| o | Unsigned octal integer | 0xF065,o | 0170145 |
| x, X | Hexadecimal integer | 61541,X | 0x0000F065 |
| l, h | Long or short prefix for d, i, u, o, x, X | 0x00406042,hx | 0x0c22 |
| f | Signed floating-point | 3./2.,f | 1.500000 |
| e | Signed scientific notation | 3./2,e | 1.500000e+000 |
| g | Signed floating-point or signed scientific notation, whichever is shorter | 3./2,g | 1.5 |
| c | Single character | 0x0065,c | 'e' |
| s | ANSI String | szHiWorld,s | "Hello world" |
| su | Unicode string | szWHiWorld,su | "Hello world" |
| hr | HRESULT or Win32 error code | 0x00000000,hr | S_OK |
| wc | Windows class flag | 0x00000040,wc | WC_DEFAULTCHAR (Note that although documented, this format doesn't work in Visual Studio .NET.) |
| wm | Windows message numbers | 0x0010,wm | WM_CLOSE |
| Symbol | Format Description | Sample | Display |
|---|---|---|---|
| ma | 64 ASCII characters | 0x0012ffac,ma | 0x0012ffac .4...0...".0W&.......1W&. 0.:W..1...."..1.JO&.1.2.." ..1...0y....1 |
| m | 16 bytes in hexadecimal format followed by 16 ASCII characters | 0x0012ffac,m | 0x0012ffac b3 34 cb 00 84 30 94 80 ff 22 8a 30 57 26 00 00 .4...0...".0W&.. |
| mb | 16 bytes in hexadecimal format followed by 16 ASCII characters | 0x0012ffac,mb | 0x0012ffac b3 34 cb 00 84 30 94 80 ff 22 8a 30 57 26 00 00 .4...0...".0W&.. |
| mw | 8 words | 0x0012ffac,mw | 0x0012ffac 34b3 00cb 3084 8094 22ff 308a 2657 0000 |
| md | 4 double words | 0x0012ffac,md | 0x0012ffac 00cb34b3 80943084 308a22ff 00002657 |
| mq | 4 quadwords | 0x0012ffac,mq | 0x0012ffac 8094308400cb34b3 00002657308a22ff |
| mu | 2-byte characters (Unicode) | 0x0012ffac,mu | 0x0012ffac 34b3 00cb 3084 8094 22ff 308a 2657 0000 ?.?????. |
| # | Expands a pointer to a memory location to the specified number of values | pCharArray,10 | Expanded array of 10 characters using +/-expanders |
The number format specifier ,# allows you to expand a pointer to a memory location to a specified number of values. If you have a pointer to an array of 10 longs, the Watch window will show only the first value. To see the entire array, follow the variable with the number of values you'd like to see. For example, pLong,10 would show an expandable array of your 10 items. If you have a large array, you can point to the middle of it and expand just the values you want with, for example, (pBigArray+100),20, to show the 20 elements starting at offset 99. You'll notice that when you enter a value such as this, the index values always begin at 0, regardless of the position of the first displayed element. In the pBigArray example, the first index will be shown as 0 even though it's the 100th array element. The second index, the 101st array element, will be shown as 1, and so on.
In addition to allowing you to format the data as you'd like it, the Watch window allows you to cast and cajole your data variables so that you can see exactly what you need to see. For example, you can use the BY, WO, and DW expressions to get at pointer offsets. To see the current thread ID in the Watch window, you could use DW($TIB+0x24). The address-of operator (&) and the pointer operator (*) are also allowed, and both allow you to get the values at memory addresses and to see the results of casts in your code.
One great trick I like to use in my native debugging is watching variable values up the stack. Sometimes you have a local variable you'd like to keep an eye on as you're stepping through other functions. With the advanced breakpoint syntax context portion, which I discussed in the "Advanced Breakpoint Syntax" section earlier in this chapter, you can explicitly watch a value. For example, if you have a variable szBuff declared in the function CopyDatabaseValue, located in source file FOO.CPP in module DB.DLL, you'd specify the exact value of szBuff as {CopyDatabaseValue,FOO.CPP,DB.DLL}szBuff. Now, no matter where you are inside functions called by CopyDatabaseValue, you can easily keep an eye on szBuff.
Timing Code in the Watch Window
Here's another neat trick—using the Watch window to time code. The $CLK pseudoregister can serve as a rudimentary timer. In many cases, you want just a rough idea of the time between two points, such as how long a call to the database took. $CLK makes it easy to find out how long the call took. Keep in mind that this time includes the debugger overhead. The trick is to enter two $CLK watches, the first being just $CLK and the second $CLK=0. The second watch zeros out the timer after you start running again. Although not a perfect timer, $CLK is good enough for some ballpark guesses.
The Undocumented Pseudoregisters
Two new pseudoregisters have shown up in Visual Studio .NET. Since the word undocumented is in the title of this section, I have to warn you that these values might disappear in future versions of the debugger. The first pseudoregister is $HANDLES. This shows the number of open handles in the current process. This is a killer idea that allows you to keep an eye on handle leaks as you're debugging. If you see the number reported by $HANDLES creeping up, you know you have a leak. $HANDLES,d has a permanent place in my Watch window because it's so amazingly useful.
The second undocumented pseudohandle is $VFRAME, a great feature for helping track down the stack in release builds. $VFRAME is short for virtual frame pointer. On IA32 machines, $VFRAME points to the next stack frame so that you can use it to help walk the stack back manually. If you're using standard stack frame, $VFRAME points to the previous item's EBP value.
Expanding Your Own Types Automatically
Although managed C++ and C# debugging allows you to expand your own types in the Watch window, the autoexpansion offered by native debugging takes this ability to new heights. In fact, starting with Visual Studio .NET 2003, the Watch window and data tips now attempt to show you the first few members of structures and classes automatically. However, you've probably seen a few common types, such as CObject, RECT, and some of the STL types, expand in the Watch window with even more information, which all happens to be provided by the autoexpand rules. The magic happens in the AUTOEXP.DAT text file located in the <Visual Studio .NET installation directory>\ COMMON7\PACKAGES\DEBUGGER subdirectory. You can add your own types to the autoexpand list by entering them into the AUTOEXP.DAT file. (Unfortunately, the AUTOEXP.DAT file must reside in that directory, so you'll have to set your version control software's working directory to pull AUTOEXPAND.DAT to that directory.)
As an example, I'll add an autoexpand entry for the PROCESS_INFORMATION structure that is passed to the CreateProcess API function. The first step is to check what the Visual Studio .NET debugger recognizes as the type. In a sample program, I put a PROCESS_INFORMATION variable in the Watch window and looked at the Type column on the right side of the Watch window. The type was _PROCESS_INFORMATION, which if you look at the following structure definition, matches the structure tag.
typedef struct _PROCESS_INFORMATION { HANDLE hProcess; HANDLE hThread; DWORD dwProcessId; DWORD dwThreadId; } PROCESS_INFORMATION The documentation in AUTOEXP.DAT says that the format for an autoexpand entry is type=[text]<member[,format]>.... Table 7-4 shows the meanings for each field. Note that more than one member can be displayed as part of the autoexpand.
| Field | Description |
|---|---|
| Type | The type name. For template types, this field can be followed by <*> to encompass all derived types. |
| Text | Any literal text. This field is generally the member name or a shorthand version of it. |
| member | The actual data member to display. This field can be an expression, so if you need to add some offsets to various pointers, you can include the offsets in the calculation. The casting operators also work. |
| format | Additional format specifiers for the member variables. These specifiers are the same as the formatting symbols shown in Table 7-2. |
With the PROCESS_INFORMATION structure, I'm interested in looking at the hProcess and hThread values, so my autoexpand rule would be _PROCESS_INFORMATION =hProcess=<hProcess,X> hThread=<hThread,X>. I use the ,X format specifiers because I always want to see the values as hexadecimal values. Figure 7-4 shows the autoexpand rule for _PROCESS_INFORMATION showing up in a data tip in the source window.
![]()
Figure 7-4: Autoexpand in a data tip
When entering my new autoexpand rule, I must place it after the section of the AUTOEXP.DAT file delineated by [AutoExpand]. Your best bet is to place your values right after [AutoExpand] so that you can find them easily and not mess up the techniques I'll discuss in the next section. The good news is that unlike the managed debugging autoexpands that are read only when you start Visual Studio .NET, the AUTOEXP.DAT file is read in each time you debug, so developing native autoexpand rules is much easier.
One special formatting code you'll see in the file is <,t>. This code tells the debugger to put in the type name of the most derived type. For example, if you have a base class A with a derived class B and only A has an autoexpand rule, the autoexpand for a variable of type B will be the class name B followed by the autoexpand rule for class A. The <,t> format is very helpful for keeping your classes straight.
Adding Your Own HRESULT Values
In addition to expanding your types, the Visual Studio .NET Watch window now has provisions to show your custom HRESULT values as text instead of as some hard-to-decipher number. The magical AUTOEXP.DAT also holds these values. At the end of the AUTOEXP.DAT file, add a new section named [hresult] and add each custom HRESULT using the following pattern: "<unsigned decimal value>=<HRESULT text>." The code that follows is an example that includes some of the values not handled automatically by the debugger. If you'd like to see the actual HRESULT value for one of the built-in conversions or one you've added to the [hresult] section, take the HRESULT variable and append ,u or ,x to the variable. That will force the variable to be displayed as an unsigned integer or a hexadecimal value, respectively.
[hresult] 2147500051=CO_E_CANT_REMOTE 2147500056=CO_E_CREATEPROCESS_FAILURE 2147500059=CO_E_LAUNCH_PERMSSION_DENIED
Adding Super Customized Display to the Watch Window
A major enhancement to the Watch window that's shown up for native debugging is the Expression Evaluator Add-In (EEAddIn). What EEAddIn allows you to do is to have the debugger call one of your DLLs when the Watch window is evaluating a specific type. This gives you an excellent opportunity to provide calculations that will display data in a more relevant way. For example, the Watch window will display a SYSTEMTIME structure (which represents the Win32 date and time) as a bunch of hexadecimal numbers, making it impossible for you to determine the time. When you use an EEAddIn, the Watch window displays a readable string such as {5/13/2002 12:51 AM} instead.
To tell the Watch window you have an EEAddIn DLL you'd like to load, you place an entry for each type you want to evaluate in the ubiquitous AUTOEXP.DAT file. Under the [AutoExpand] section, you'll indicate the expansion for a type using the following syntax:
type name=$ADDIN(dll name,exported function)
The type name is, as with the autoexpand rules, the name for the type the Watch window displays in the Type column for the variable. The DLL name is the name of the DLL. The documentation for the EEAddIn, which is just sample Visual Studio .NET project named, appropriately, EEAddIn, indicates that the DLL name just needs to be the name of the DLL because you're supposed to put your EEAddIns in the same directory as AUTOEXP.DAT. However, I've found that you should indicate the complete path to the DLL as part of the DLL name to ensure proper loading. The exported function is the function you want called to process your custom display for the given type.
Since your EEAddIns run in the address space of the debugger, you need to ensure that you properly handle any possible exceptions because you'll crash the debugger if you don't. The individual exported functions must match the CUSTOMVIEWER prototype, as shown in Listing 7-1. When your function is called, it will receive as parameters the address of the type; a pointer to a helper structure, DEBUGHELPER; the numeric base currently selected (decimal or hexadecimal); a Boolean value indicating whether the debugger is expecting UNICODE strings (which in Visual Studio .NET is ignored as it always expects ANSI characters returned); the string buffer to write the result to; and the maximum length of the string buffer. The helper structure, also shown in Listing 7-1, has a few pointers to functions you can call to get information about the values at the address for the type. The most important are GetRealAddress and ReadDebuggeeMemoryEx. You'll pass the address handed to your exported function, stored in GetRealAddress, to get the real address for the variable. You'll pass that value on to ReadDebuggeeMemoryEx in order to get the bytes for the type. The beauty of the helper class is that it completely hides the magic necessary to get the data out of local and remote debuggee processes.
Listing 7-1: EEAddIn export prototype and helper structure
/*--------------------------------------------------------------------- The only definition of the Expression Evaluator AddIns Lifted from The EEAddIn Sample Project ---------------------------------------------------------------------*/ typedef struct tagDEBUGHELPER { DWORD dwVersion ; BOOL (WINAPI *ReadDebuggeeMemory)( struct tagDEBUGHELPER * pThis , DWORD dwAddr , DWORD nWant , VOID * pWhere , DWORD * nGot ); // from here only when dwVersion >= 0x20000 DWORDLONG (WINAPI *GetRealAddress)( struct tagDEBUGHELPER *pThis ) ; BOOL (WINAPI *ReadDebuggeeMemoryEx)( struct tagDEBUGHELPER *pThis , DWORDLONG qwAddr , DWORD nWant , VOID* pWhere , DWORD * nGot ); int (WINAPI *GetProcessorType)( struct tagDEBUGHELPER *pThis ) ; } DEBUGHELPER ; // The prototype each of your functions must be. typedef HRESULT (WINAPI *CUSTOMVIEWER)( DWORD dwAddress , DEBUGHELPER * pHelper , int nBase , BOOL bUniStrings , char * pResult , size_t max , DWORD reserved ) ; Your exported function's job is to convert those bytes read in from the debuggee into something displayable in the Watch window. Since you can easily read the memory out of the debuggee, you'll be working with a copy of the information. When I first got a glimpse of the EEAddIn architecture, I immediately thought of a million cool displays I would love to have. The first was one that would take an HINSTANCE or HMODULE and show the value followed by the name of the DLL at that location. Of course, reality then intruded. Converting an HINSTANCE or HMODULE into a DLL name required a handle to the process. The DEBUGHELPER structure in Listing 7-1 gives you a way to read memory but not get the process handle. Of course, that's when I realized that if my EEAddIn function was working on a process being debugged remotely, even having the process handle wouldn't help because I couldn't do anything with that handle on the machine the debugger was running on. Maybe a future version of Visual Studio .NET will offer a means of querying information from the process that needs handle values.
Even with the restriction that you can read only the debuggee's memory, plenty of excellent opportunities to put better displays in the Watch window are still open to you so that you can debug faster. Included with this book's sample code is my current EEAddIn, BSU_ExpEval_AddIn. At the time I wrote this paragraph, I incorporated the _SYSTEMTIME and _FILETIME displays from the sample provided by Visual Studio, but I put error handling around them as well as the following structure expansions: _OSVERSIONINFOA, _OSVERSIONINFOW, _OSVERSIONINFOEXA, and _OSVERSIONINFOEXW. Now when you have one of the structures handled by GetVersionEx, you can see them displayed as shown in Figure 7-5, which shows some of the output of the test program for BSU_ExpEval_AddIn. Listing 7-2 shows the work necessary to expand the _OSVERSIONINFOA structure.
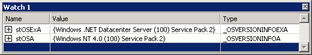
Figure 7-5: EEAddIns at work
One debugging tip with EEAddIn DLLs is that if you return E_FAIL from your function, the Watch window will display "???", so you might want to return S_OK and set the result text to "…" so that your output matches the normal Watch window display. This can help you debug the DLL as well. Another tip is to consider putting failure results in the result text of your debug versions to make your debugger extensions easier to debug. Finally, if enough of us start sharing our EEAddIns, we can get much better debugging information than ever before from the IDE. I'd encourage you to look at any structures or classes you can from Win32, MFC, and ATL and see whether you can provide better output.
Listing 7-2: EEAddIn example for _OSVERSIONINFOA
// This touches only the first 5 DWORDS in the structs, so you can pass // both the ANSI and UNICODE versions in. static int ConvertBaseOSV ( LPOSVERSIONINFOA pOSVA , char * szStr ) { int iCurrPos = 0 ; if ( ( pOSVA->dwMajorVersion == 4 ) && ( pOSVA->dwMinorVersion ==0)) { if ( pOSVA->dwPlatformId == VER_PLATFORM_WIN32_NT ) { iCurrPos = wsprintf ( szStr , _T ( "Windows NT 4.0 " ) ) ; } else { iCurrPos = wsprintf ( szStr , _T ( "Windows 95 " ) ) ; } } else if ( ( pOSVA->dwMajorVersion == 4 ) && ( pOSVA->dwMinorVersion == 10 ) ) { iCurrPos = wsprintf ( szStr , _T ( "Windows 98 " ) ) ; } else if ( ( pOSVA->dwMajorVersion == 4 ) && ( pOSVA->dwMinorVersion == 90 ) ) { iCurrPos = wsprintf ( szStr , _T ( "Windows Me " ) ) ; } else if ( ( pOSVA->dwMajorVersion == 5 ) && ( pOSVA->dwMinorVersion == 0 ) ) { iCurrPos = wsprintf ( szStr , _T ( "Windows 2000 " ) ) ; } else if ( ( pOSVA->dwMajorVersion == 5 ) && ( pOSVA->dwMinorVersion == 1 ) ) { iCurrPos = wsprintf ( szStr , _T ( "Windows XP " ) ) ; } else if ( ( pOSVA->dwMajorVersion == 5 ) && ( pOSVA->dwMinorVersion == 2 ) ) { iCurrPos = wsprintf ( szStr , _T ( "Windows Server 2003 " ) ) ; } else { // Beats me! iCurrPos = 0 ; } return ( iCurrPos ) ; } // Again, this function uses the shared field between the A and W // versions, so you can use it for both. static int ConvertBuildNumber ( LPOSVERSIONINFOA pOSVA , char * szStr ) { int iCurrPos = 0 ; if ( VER_PLATFORM_WIN32_NT == pOSVA->dwPlatformId ) { iCurrPos = wsprintf ( szStr , _T ( "(%d) " ) , pOSVA->dwBuildNumber ) ; } else if ( VER_PLATFORM_WIN32_WINDOWS == pOSVA->dwPlatformId ) { WORD wBuild = LOWORD ( pOSVA->dwBuildNumber ) ; iCurrPos = wsprintf ( szStr , _T ( "(%d) " ) , wBuild ) ; } return ( iCurrPos ) ; } ADDIN_API HRESULT WINAPI AddIn_OSVERSIONINFOA ( DWORD /*dwAddress*/ , DEBUGHELPER* pHelper , int /*nBase*/ , BOOL /*bUniStrings*/ , char * pResult , size_t /*max*/ , DWORD /*reserved*/ ) { if ( pHelper->dwVersion < 0x20000 ) { // I'm not touching less than VS.NET. return ( E_FAIL ) ; } HRESULT hRet = E_FAIL ; __try { DWORDLONG dwRealAddr = pHelper->GetRealAddress ( pHelper ); DWORD nGot = 0 ; OSVERSIONINFOA stOSA ; // Try and read in the structure. if ( S_OK == pHelper-> ReadDebuggeeMemoryEx ( pHelper , dwRealAddr , sizeof ( OSVERSIONINFOA ) , &stOSA , &nGot )) { // Make sure I got all of it. if ( nGot == sizeof ( OSVERSIONINFOA ) ) { // Do the dance... char * pCurr = pResult ; int iCurr = ConvertBaseOSV ( &stOSA , pCurr ) ; if ( 0 != iCurr ) { pCurr += iCurr ; iCurr = ConvertBuildNumber ( &stOSA , pCurr ) ; pCurr += iCurr ; if ( '\0' != stOSA.szCSDVersion[0] ) { wsprintf ( pCurr , _T ( "%s" ) , stOSA.szCSDVersion ) ; } } else { _tcscpy ( pResult , _T ( "..." ) ) ; } } hRet = S_OK ; } } __except ( EXCEPTION_EXECUTE_HANDLER ) { hRet = E_FAIL ; } return ( hRet ) ; }
YES! In versions of Visual Studio prior to Visual Studio .NET, the native debugging information was limited to a maximum of 255 characters. This wasn't a problem in the C days, but the advent of templates completely blew past 255 characters for even the simplest types. Visual Studio .NET can have arbitrary length debug symbols, so you should see complete expansion. This also means that the old C4786 informational message (debug information greater than 255 characters), which stopped compiles when treating warnings as errors, has finally been buried once and for all! We've been blessed!
|
EAN: 2147483647
Pages: 177