Advanced Breakpoints for Native Applications
|
Chapter 5 introduced the common breakpoints between native and managed applications. In this chapter, I'll turn to the unique issues related to native applications and some of the problems you'll run into. Additionally, I'll discuss the magical data breakpoints offered for native applications.
Advanced Breakpoint Syntax
Unlike managed debugging, native debugging has additional capabilities to control exactly when and where breakpoints occur. Because of the nature of native symbol generation, many times you need to provide the debugger with additional help so that it properly places the breakpoint where you want it. When it comes to debugging symbols, the rules are much looser than the strict C++ scoping rules. For example, it's perfectly reasonable to have multiple top-level symbols for LoadLibrary. Each module that imports LoadLibrary has a symbol for it (to indicate importing) and the module that exports it has a symbol as well (to indicate exporting). The advanced breakpoint syntax helps set the scope to the exact symbol you mean.
What's interesting about the advanced breakpoint syntax is that you used to see it all the time in Microsoft Visual C++ 6 and prior versions because that's how the old Breakpoint dialog box displayed the breakpoints you set. In Visual Studio .NET, you no longer see any advanced breakpoint syntax displayed, but you still need to know what that syntax is to truly control the debugger.
The advanced breakpoint syntax is composed of two parts. The first part is the context portion, and the second part is the location, expression, or variable. You can think of the context portion just as you do the scope of a variable when programming. The context simply provides the debugger with an unambiguous location for your breakpoint.
In debugger terms, the function, the source file, and the binary module specify the context, and the context is delineated in advanced breakpoint syntax as "{[function],[source file],[binary module]}." You need to specify only enough context information to get the breakpoint set, so the context portion can contain a single field or as many as all three. In your run-of-the-mill location breakpoint, all the information the debugger needs is the name of the source file. For example, in Visual C++ 6, you saw a standard location breakpoint on line 20 of TEST.CPP displayed in the Breakpoint dialog box as {,TEST.CPP,}.20. In fact, if you want to set that same breakpoint in Visual Studio .NET the really hard way, you can enter {,TEST.CPP,}@20 in the Function edit control on the Function tab of the New Breakpoint dialog box. After you click OK, the "IntelliSense could not find the specified location. Do you still want to set the breakpoint?" message box pops up because IntelliSense doesn't know the advanced breakpoint syntax. Click Yes in the message box, and you'll see when you run the program that your breakpoint gets set. If you're already debugging, you'll see the red dot appear on the line.
The ability to specify the context for a location breakpoint allows you to solve a particularly nasty type of debugging problem. Consider the case in which you have a source file with a diagnostic function, CheckMyMem, used by two DLLs, A.DLL and B.DLL, and the function appears in both DLLs by static linking. Because you're doing lots of proactive programming, you're calling the function a great deal from both DLLs. However, you're experiencing a random crash only in B.DLL. If you set a standard location breakpoint in the CheckMyMem source code on line 27, the breakpoint will trigger in both DLLs even though you just want to see the calls made in B.DLL. To specify that you want the location breakpoint to trigger only in B.DLL, you would need to manually enter the breakpoint context {,CHECKMYMEM.CPP,B.DLL}@27. Although you're probably thinking this is a contrived example and you'd never share source code between modules like this, you probably never thought about what happens when you use inline functions in your C++ classes!
The second part of the advanced breakpoint syntax is where the location, expression, or variable is specified. However, in Visual Studio .NET, other than setting the source line and function name, as you'll see in a moment, you can't set any other values. That's not a problem because setting advanced breakpoints in Visual Studio .NET is much easier than setting them in Visual C++ 6 was.
Breakpoints on System or Exported Functions
In Chapter 5, I talked about all sorts of cool ways you could simply type in the name of a function or method and automatically get a breakpoint set. However, I didn't talk about setting a breakpoint on a function your program imports from a DLL. By setting a breakpoint on those DLL exported functions, you can solve some extremely hard problems. For example, you can gain control of the processing at a known point so that you can track down subsequent memory corruptions. Another good example is when you want to peek at what sort of information is being passed in various parameters. Interestingly, if you try to set the exported function breakpoint, you'll be disappointed. It doesn't work. There's nothing wrong with the debugger—you just need to give it some context information about where it can find the function. Additionally, one other small detail is important: the function name depends on whether symbols for the DLL are loaded. Before I get into this discussion, you first have to set the Visual Studio .NET debugger to load exports as symbols. In the Options dialog box\Debugging folder\Native property page, check Load DLL Exports. The reason for setting this option is that even if you don't have symbols, at least the exported symbols for the module will have a "pseudosymbol" table built out of the exported functions from the DLL. This way you'll see names for those exported functions instead of hexadecimal numbers.
To illustrate how to set a breakpoint on a system DLL, I'll set a breakpoint on the KERNEL32.DLL LoadLibrary function. You might want to follow along so that you can see the steps in action. As all real programs call LoadLibrary, you can pick any application to debug. Start by stepping into the program to get the debugger running and to initialize all symbol tables. If you just try specifying LoadLibrary in the New Breakpoint dialog box, you'll see that when you click the OK button, the breakpoint looks like it's accepted. However, as you should know by now, always check the Breakpoints window to see whether the breakpoint has a question mark or an exclamation point icon next to it, which indicates the breakpoint isn't set. In the application I'm using to set the breakpoints, WDBG from Chapter 4, the Breakpoint window shows the question mark icon next to text that shows this type LoadLibrary(const unsigned short *).
The first step to setting an exported function breakpoint is to determine whether you have symbols loaded for the module that contains the export. Since you all should have stopped reading at the end of Chapter 2 and immediately created a symbol server so that you could always get all operating system symbols, you should have symbols loaded. There are two ways to check symbol loading. First, in the Debug Output window, if you see the text "'<Program>' : Loaded '<DLL>', Symbols loaded.", you have symbols loaded. The second way is with the Modules windows, accessible from the Windows submenu of the Debug menu or by pressing Ctrl+Alt+U using the default keyboard. The far-right column of the Module window, titled Information, tells you whether symbols are loaded. Highlight the module you're interested in and scroll all the way over to the right. If the Information column for your module displays Symbols Loaded, you have symbols. If it says anything else, and you know you have the correct PDB file for the DLL, right-click on the item in the Modules window and select Reload Symbols from the context menu. The Reload Symbols: filename.pdb dialog box that comes up allows you to browse for the correct PDB file. Since the symbol server will make setting up symbols trivial, I strongly suggest you go that route. If either the Debug Output window or the Modules window says anything else, you don't have symbols loaded.
If symbols aren't loaded, the location string you'll use is the name exported from the DLL. You can check the name by running the DUMPBIN utility, which comes with Visual Studio .NET, on the DLL: DUMPBIN /EXPORTS DLL Name. If you run DUMPBIN on KERNEL32.DLL, you won't see a LoadLibrary function but rather two similarly named functions, LoadLibraryA and LoadLibraryW. (LoadLibraryExA and LoadLibraryExW are different APIs.) Suffixes indicate the character set used by the function: the A suffix stands for ANSI and the W stands for Wide, or Unicode. Microsoft Windows operating systems other than Microsoft Windows 98/Me use Unicode internally for internationalization. If you compiled your program with UNICODE defined, you'll want to use the LoadLibraryW version. If you didn't, you can use LoadLibraryA. However, LoadLibraryA is just a wrapper that allocates memory to convert the ANSI string to Unicode and calls LoadLibraryW, so technically you could use LoadLibraryW as well. If you know for sure that your program is going to call only one of these functions, you can just set the breakpoint on that function. If you're not sure, set breakpoints on both functions.
If your application is targeting only Microsoft Windows 2000, Microsoft Windows XP, or.NET Server 2003, you should use Unicode throughout. You can get a nice performance boost. Matt Pietrek, in his December 1997 "Under the Hood" column in Microsoft Systems Journal, reported that the ANSI wrappers had a sizeable performance hit associated with them. In addition to having a faster program, you'll be several steps closer to full internationalization by using Unicode.
If symbols aren't loaded, the breakpoint syntax for breaking on LoadLibrary is {,,KERNEL32.DLL}LoadLibraryA or {,,KERNEL32.DLL}LoadLibraryW. If symbols are loaded, you need to do some calculations because you'll need to match the decorated symbol name. What you need to know is the calling convention of the exported function and the function prototype. I'll get into much more detail about calling conventions later in this chapter. For the LoadLibrary function, the prototype from WINBASE.H (with some macros expanded for clarity) is as follows:
__declspec (dllimport) HMODULE __stdcall LoadLibraryA( LPCSTR lpLibFileName );
The WINBASEAPI macro expands into the standard call calling convention, __stdcall, which, by the way, is the calling convention for all system API functions. Standard call functions are decorated with an underscore prefix and suffixed with an "@" sign followed by the number of bytes pushed on the stack. Fortunately, calculating the number is easy; it's the sum of the parameter byte count. With the Intel Pentium family of CPUs, you can just count the number of parameters and multiply by 4. In the case of LoadLibrary, which takes one parameter, the final name is _LoadLibraryW@4. Here are some examples that will give you an idea of what final names look like: CreateProcess, which has 10 parameters, is _CreateProcessW@40; and TlsAlloc, which has no parameters, is _TlsAlloc@0. Even if a function doesn't have any parameters, you must keep the "@#" format. As is the case when symbols aren't loaded, the ANSI and Unicode conditions still apply. If symbols are loaded, the breakpoint syntax for breaking on LoadLibrary is {,,KERNEL32.DLL}_LoadLibraryA@4 or {,,KERNEL32.DLL}_LoadLibraryW@4.
After you've figured out the advanced breakpoint syntax for setting the breakpoint, bring up the New Breakpoint dialog box by pressing Ctrl+B. On the Function tab/Function edit control, enter the appropriate advanced breakpoint syntax. After clicking OK, you'll get the usual warning about IntelliSense not finding the breakpoint. Click OK so that the debugger will set the breakpoint. Look in the Breakpoints window and you'll see that a full red dot is next to the breakpoint and the Name column lists the breakpoint in full syntax glory. You can also right-click the breakpoint and select Go To Disassembly from the context menu to see where the exported function resides in memory.
Conditional Expressions
Although managed code allows you to call methods and properties from conditional expression breakpoint modifiers, native code doesn't. Additionally, conditional expressions can't evaluate C++ macro values, so if you want to compare a value against TRUE, you'd have to use 1 instead (though true and false are evaluated correctly evaluated). With C++ code, as with the particular languages in managed code, any conditional expressions must use the C++ values. Even with these small limitations, location breakpoint conditional expression modifiers are extremely powerful because in addition to the ability to evaluate variables values, you have access to a special set of values named pseudoregisters.
For the most part, pseudoregisters are register values that appear on the CPU. Visual Studio .NET greatly improved the register types you can use and display. In addition to the regular CPU registers, Visual Studio now supports advanced registers such as MMX, SSE, SSE2, and 3DNow! Some examples of pseudoregisters are shown in Table 7-1. Notice that actual CPU registers have the @ delimiter and that the two special values start with $. You can find the complete list of register values by consulting the CPU documentation for both Intel and AMD (Advanced Micro Devices). Remember that in Visual C++ 6, you could also specify @ in front of pseudoregisters. For backward compatibility, you can still do the same with Visual Studio .NET 2003, but future versions will support only $ on pseudoregisters, so you should get used to setting it now. Additionally, to view the value, some of you are used to entering the register values without the @ in front of the register name. However, I'll always show registers with the @ prefix.
| Pseudoregister | Description |
|---|---|
| @EAX | The return value register (32-bit value) |
| @BL | Low word of EBX register (16-bit value) |
| @MM0 | MMX register 0 |
| @XMM1 | Streaming SIMD Extensions (SSE) register 1 |
| $ERR | Last error value (special value) |
| $TIB | Thread information block (special value) |
The last two values in Table 7-1 offer extra power with conditional breakpoints. With $ERR, you can look at the thread's last error value (the value returned by calling the GetLastError API), so you'd stop only when that last error condition was met. For example, if you wanted to stop only when the last error value returned by an API function was ERROR_INSUFFICIENT_BUFFER, indicating a data buffer was too small, you'd first look up ERROR_INSUFFICIENT_BUFFER in WINERROR.H and see the value is 122. Your breakpoint conditional expression would be $ERR==122.
The $TIB special pseudoregister opens up a solution to a vexing problem in Visual Studio .NET. Unfortunately, there's no built-in way to explicitly set a location breakpoint that fires only in a specific thread. (As you'll see in the next chapter, WinDBG does have this capability built in). When working on big server applications such as ISAPI filters, it's very common to have a few methods that are called by lots of threads, but you don't want to wear out your index finger pressing GO a million times because the debugger stops at each occurrence in each thread. The first step to getting around this problem is to be stopped in the debugger and bring up the Threads window so that you can see all the thread IDs. Determine which thread you want to stop in and remember the thread ID. The second step is to set a location breakpoint on the common routine and bring up the New Breakpoint dialog box by right-clicking on the breakpoint and selecting Properties. Click the Condition button and type in the following expression: *(long*)($TIB+0x24) == <thread id>. The thread ID is at offset 0x24 in the thread information block. (You can find this by reverse engineering GetCurrentThreadId, which we'll do later in the chapter.)
Finally, because you can't call functions in your expressions, breaking on a string with a specific value is difficult. In that case, just set up an expression that checks each character, such as this:
(szBuff[0]=='P')&&(szBuff[1]=='a')&&(szBuff[2]=='m')
If you read the previous chapter, you know that it's easy to set the thread name appearing in the Threads window. Microsoft has documented a way to do the same thing in native applications. By default, native applications show the name of the function where the thread started. To show the actual name, you can use a special exception value to pass in a new name to use, and the debugger writer must read the memory address passed as part of the exception. I wrapped up the necessary code into a set of functions in ![]() BUGSLAYERUTIL.DLL: BSUSetThreadName and BSUSetCurrentThreadName. The code for BSUSetThreadNameA is shown here. After calling this function, the Threads window will show whatever you specified as the name. Unlike in managed code, in native code, you can change the thread name all you want. Finally, only the first 31 characters of the name are shown in the debugger.
BUGSLAYERUTIL.DLL: BSUSetThreadName and BSUSetCurrentThreadName. The code for BSUSetThreadNameA is shown here. After calling this function, the Threads window will show whatever you specified as the name. Unlike in managed code, in native code, you can change the thread name all you want. Finally, only the first 31 characters of the name are shown in the debugger.
typedef struct tagTHREADNAME_INFO { DWORD dwType ; // Must be 0x1000 LPCSTR szName ; // Pointer to name (in user addr space) DWORD dwThreadID ; // Thread ID (-1=caller thread) DWORD dwFlags ; // Reserved for future use, must be zero } THREADNAME_INFO ; void BUGSUTIL_DLLINTERFACE __stdcall BSUSetThreadNameA ( DWORD dwThreadID , LPCSTR szThreadName ) { THREADNAME_INFO stInfo ; stInfo.dwType = 0x1000 ; stInfo.szName = szThreadName ; stInfo.dwThreadID = dwThreadID ; stInfo.dwFlags = 0 ; __try { RaiseException ( 0x406D1388 , 0 , sizeof ( THREADNAME_INFO ) / sizeof ( DWORD ) , (DWORD*)&stInfo ) ; } __except ( EXCEPTION_CONTINUE_EXECUTION ) { } }
Data Breakpoints
Data breakpoints, also called global memory breakpoints, are one of the most powerful tools you have at your disposal. With a data breakpoint, whenever anything changes a particular piece of memory, the debugger stops immediately at the point right after the memory was changed. Data breakpoints are global in scope and are not related to any location except the one doing the memory change. As you can imagine, data breakpoints are just the thing for tracking down all sorts of problems like memory corruptions or overwrites.
In Visual C++ 6, getting data breakpoints set was a little tricky, but now they're pretty easy to use. The big problem was that with Visual C++ 6, if you didn't get the breakpoint set correctly, the debugger simply single-stepped every assembly instruction in your application and checked the memory location after each execution. Needless to say, having an exception and a few cross-process transitions on each exception was excruciatingly slow. If you did fall into this trap, the only thing you could do was kill the debugger. Fortunately, with Visual Studio .NET, you now get a warning message when you set the data breakpoints wrong.
What's neat about data breakpoints is that the heavy lifting behind them comes from the CPU instead of the debugger. Intel CPUs have four special registers, named the debug registers (DR0–DR3), that the CPU can use to set a hardware breakpoint on memory accesses. These debug registers are limited to monitoring an address and 1 byte, 2 bytes, or 4 bytes at that address. That means you can monitor a maximum of 16 bytes in your program at any given time.
The trick to setting data breakpoints is to use the address of the memory you want to watch. The New Breakpoint dialog box implies you can enter the variable name, but many times using the variable name will bring up a message box similar to Figure 7-1. When you see that message, always click No, because if you click Yes, the debugger will set the breakpoint by single-stepping every assembly language instruction in order to determine when the memory changes.
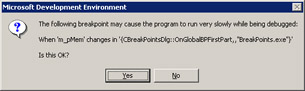
Figure 7-1: Data breakpoint about to cause single stepping
After you get the address of the memory you want to watch, setting a data breakpoint is pretty easy. Bring up the New Breakpoint dialog box and make the Data tab active, as shown in Figure 7-2. In the Variable edit control, enter the address you'd like to watch. It's critical you keep data alignment in mind when entering the address. The Items field indicates how many bytes you want to watch at that address. If you want to watch 4 bytes (a double word) the address you enter must end in 0, 4, 8, or C to maintain alignment. Likewise, if you want to watch only 2 bytes (a word), the address must end in 0, 2, 4, 6, 8, A, C, or E. If you try to set a data breakpoint where the alignment is off, such as setting a memory address that ends in 7 and setting the Items field to 4, the data breakpoint will appear to be set, but the debugger won't actually stop when the breakpoint is accessed. Interestingly, if you attempt to set a 4-byte data breakpoint on an address that ends in A, for example, the debugger will shift the breakpoint back to the natural alignment 2 bytes in front.
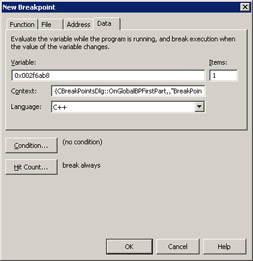
Figure 7-2: Setting a data breakpoint
As you can see in Figure 7-2, there are two additional fields available for setting data breakpoints. The Context field is used when you specify a variable name in the Variable field in case the variable is at a different scope from the current location. Since it's much better to use addresses, you can safely ignore the Context field. The same goes for the Language field because when using addresses, the language is ignored as well.
One incredibly great improvement to data breakpoints in Visual Studio .NET as compared with Visual C++ 6 is that you can now associate them with hit counts as well as conditions. This allows you to completely fine-tune the exact state you'll stop in the debugger.
Once you've entered your data breakpoint and checked the Breakpoints window to make sure the data breakpoint is fully validated, you can start running your application. When the data at the specified address changes, something interesting happens in the debugger, as shown in Figure 7-3. A message box appears indicating that your data breakpoint was hit. Many developers have questioned me as to why data breakpoints get this special treatment. The reason has to do with a really difficult user interface problem. Since data breakpoints can be triggered anywhere, having the debugger stop only at a point where no red dots in the margin indicate a breakpoint would be a little disconcerting. By popping up the message box, you at least know why the debugger stopped.
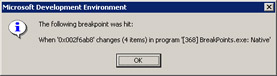
Figure 7-3: Hitting a data breakpoint
When using data breakpoints, after you stop a debugging session, you probably want to clear any data breakpoints you've set. Since I recommend using addresses for the data breakpoints, it's very probable that the memory location you want to watch will move around in subsequent runs. This is especially true with the stack memory you're watching.
Better Data Breakpoints
The new and improved data breakpoints are a wonderful improvement to Visual Studio .NET native debugging. However, if you've ever looked at the Intel Architecture Software Developer's Manuals, the documentation on the debug registers indicates that the registers can be set such that every read and read/write to the memory at the address specified can cause the hardware breakpoint to trigger. The behavior of the Visual Studio .NET data breakpoints is that they trigger only when the data changes in the address specified. So if the value you're writing to a location doesn't change the data at that location, you'll never stop.
Occasionally, you do want to see who is writing or reading from a memory location no matter what. I don't know how many times I've tracked down performance problems by counting how many times memory was touched. Visual Studio .NET hides part of the power of the hardware debug registers, but I figured there had to be a way to get the full power in the debugger.
As I was pondering the solution, I got an e-mail message from Mike Morearty indicating that he wanted the same thing and had set out to solve the problem. Mike subsequently developed code that did exactly what I wanted, so there was no need for me even to think about the problem any more. All you have to do is visit http://www.morearty.com/code/breakpoint and read all about it. Mike's solution, which is really the only way to expose this functionality, is to add a small C++ class to your project that you use to set the better data breakpoint in your own code. Mike's Web page does a great job of describing how to use his CBreakpoint class, so I won't bother duplicating that information here. I will mention that since you need to create the breakpoint by manually adding code to your project, be very careful when checking code back in. If you leave the CBreakpoint class active, your daily builds won't run and you'll instantly learn the meaning of "career-limiting move"!
|
EAN: 2147483647
Pages: 177