Tips and Tricks
|
In this section I want to cover a few tips and tricks necessary to make the most of your native debugging.
Debugging Injected Code
One of the interesting new features in Visual C++ .NET is the new attributed programming model. This new model can make COM development much easier because it allows you to combine IDL attributes with your source file so that you must have only a single file to make a COM object. If you'd like to see a real example of attributed COM programming, check out the Tester object from Chapter 16. Additionally, attributed programming offers a consistent way to provide unified message handling for your applications. All the attributes work by injecting source code into your source file.
You've got several ways of debugging this injected code. When in the debugger, to see the source code, move to the Disassembly window and right-click to select Show Source Code from the context menu. However, an easier way to see what's happening with the injected source code is to compile with the /Fx switch for CL.EXE. You can turn this switch on within the Visual Studio environment by opening the Property Pages dialog box, expanding the C/C++ folder, selecting the Output Files property page, and setting Expand Attributed Source to Yes. This will create a file named sourcename.MRG.CPP in the same directory as the CPP file. You can open the file and look at the injected (merged) source code. If you'd like, you can also compile the merged file so that you can see how everything works in the source window when debugging.
The Memory Window and Auto Memory Evaluation
One huge improvement in native debugging is the Memory windows. For one thing, there's more than one, but more importantly, the Memory window no longer has the weird built-in Artificial Intelligence that made it monitor your eye movements to determine which address you were looking at and then move that address the next time you looked at the Memory window. It's also gained all sorts of additional memory display formats, so you should not have any issues seeing memory how you'd like it. Right-click in the Memory window to choose the display format. The new ability to evaluate Unicode text was a long time in coming.
Finally, the Memory window makes it much easier to automatically reevaluate changes to the memory block you're watching. In the Memory window, click the button to the right of the address field, and the debugger will keep the Memory window updated to the latest values. This functionality is especially valuable when you enter ESP (the stack pointer) so that you can monitor the stack as it changes. Later in the chapter, I'll discuss watching the stack.
Exception Monitoring
One of the biggest performance drains in native applications is the unnecessary exception. Since a native exception involves a trip to kernel mode every time it's triggered, you want to avoid it at all costs. Although the transition from user mode to kernel mode is relatively quick, all the extra work that occurs to process the exception in kernel mode eats tons of time. To help narrow down those performance bottlenecks, the Visual Studio .NET debugger's Exception dialog box allows you to control exactly how the debugger will process any exceptions. By properly understanding how to use this dialog box, you can more quickly track down your unnecessary exceptions.
Before I jump into discussing the Exception dialog box, I need to clarify what happens when an exception is encountered by a native code debugger. The instant an exception occurs, the operating system suspends the process (which means all threads stop), points at the spot where the exception occurred, and notifies the debugger that an exception occurred. This is called the first chance exception because it's the first time the debugger has an opportunity to handle it. The debugger has two choices: it can handle the exception so that the debuggee never sees the exception, or it can pass the exception on to the debuggee. The idea that the debugger can handle, or eat, the exception might strike you as odd. However, as you saw in Chapter 4, setting a breakpoint in native code entails setting the instruction at the location to INT 3, the breakpoint opcode. In the breakpoint case, the debugger is causing the exception in the debuggee, so the debugger must handle those exceptions. If the exception wasn't caused by the debugger, the debugger tells the operating system that it doesn't want to handle the exception, and the exception is passed back to the debuggee. The debugger also emits a message to the Output window indicating that a first chance exception occurred. The debuggee restarts and, if the debuggee has exception handling set up, the exception is processed and the debuggee continues on its merry way. If the debuggee doesn't have exception handling set up, the exception will propagate up to the final exception handlers inside NTDLL.DLL. At that point, the operating system will suspend the debuggee again and tell the debugger the second chance exception occurred for the exception. This means that the process is going to die from an unhandled exception.
The important issue to note about native exception handling is that when you see the first chance exception message in the Output window, an exception has occurred in your process. As I pointed out, exceptions are a performance bottleneck, so if you're seeing lots of "First-chance exception at…" messages when you run your process, you have performance issues. The insidious problem here is that C++ exception handling is implemented with structured exception handling (SEH) behind the scenes, so using C++ exceptions can kill your performance. Exceptions are for exceptional conditions. Avoid C++ exceptions in native applications for general development.
To track down performance problems related to exceptions, you can always look for exceptions in code reviews. However, that can sometimes be a daunting task on a large code base. The Exceptions dialog box in Visual Studio .NET can make stopping immediately where exceptions occur and finding where they are handled a complete piece of cake. Figure 7-7 shows the Exceptions dialog box that's accessible from the Debug menu or by pressing Ctrl+Alt+E with the default keyboard mappings.
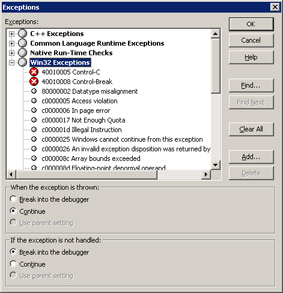
Figure 7-7: Exceptions dialog box
The Exceptions dialog box is a little confusing in that the native exceptions are split between two top level nodes, C++ Exceptions and Win32 Exceptions. The default settings are that the debugger will stop only on Control-C (0x40010005) and Control-Break (0x40010008) exceptions when debugging console applications. To tell the debugger to stop whenever any particular exception occurs, select the exception in the tree and, in the When The Exception Is Thrown (that is, on the first chance exception) group, select Break Into The Debugger. The glyph on the selected item will change to a large red ball with an X in it. In the dialog box, smaller grey balls denote exceptions that inherit their settings from the parent. A larger gray ball indicates the option is to continue on first chance exceptions. Finally, a small red ball says the parent node breaks on first chance exceptions and the child node inherits from the parent. The exception settings are stored on a per-solution basis.
What I like to do is set the Win32 Exceptions and C++ Exceptions nodes to Break Into The Debugger for both the When The Exception Is Thrown and If The Exception Is Not Handled options. That way, whenever any native exception of any kind occurs, the process will stop and allow me to determine whether the exception is legitimate. When you have either all exceptions or a single exception type set to stop, you'll see the dialog box in Figure 7-8, which shows a first chance C++ exception. If you click the Break button, you'll be dropped to the first function on the stack that has source code, which is generally directly in your code where the exception occurred. If you click Step Over or Step Into at this point, the debugger will prompt you with a message box asking whether you want to pass the exception on to the debuggee. Click Yes, and you'll immediately stop in the exception handler for the exception. This is fantastic for determining who's handling your exceptions. There are plenty of bugs for which the wrong exception handlers are handling exceptions.
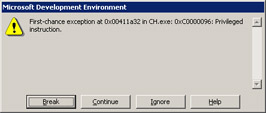
Figure 7-8: First chance exception dialog box
Clicking Continue in the first chance exception dialog box will pass the exception on to the debuggee and continue execution. The Ignore button is a little different and depends on the type of exception and whether the exception is listed in the Exceptions dialog box. If the exception is a hard exception generated by the CPU (such as an access violation), clicking the Ignore button will attempt to reexecute the offending instruction, which will pop up the first chance exception dialog box all over again. If the exception is generated by calling RaiseException (such as "0xC0000008, Invalid HANDLE was specified"), execution will continue as if the exception never occurred. Since C++ exceptions are generated through a call to RaiseException, your execution will perform as though the throw never occurred.
More Symbol Handling Tips
As I described in Chapter 2, Visual Studio .NET advanced symbol handling with the new symbol server and symbol store technology is absolutely out of this world. For native debugging, you can also set additional symbol paths inside the project, so you can have per-project symbol locations outside your normal symbol server.
In the project Property Pages dialog box\Configurations Properties\Debugging property page is a Symbol Path field. Here you can enter the specific symbol path for the project. The good news is that this is appended to any settings you have in the _NT_SYMBOL_PATH environment variable and thus doesn't overwrite them.
Detaching from Windows 2000 Processes
As you should know by now, you can detach from processes when you're debugging under Windows XP as well as Windows Server 2003. However, if you're still supporting Windows 2000, you're stuck—once you start debugging, you're debugging that process for life, which is especially irksome when debugging production server applications. Fortunately, Microsoft realized that not everyone was going to upgrade to the latest and greatest operating systems all at once and came up with a good solution for detaching from Windows 2000 processes.
Installed as part of Visual Studio .NET and the Remote Components Setup is a Win32 service named DBGPROXY, which stands for debugger proxy. This proxy service will run as the debugger on Windows 2000. This means you can easily attach and detach all you want on Windows 2000! In fact, once you execute DBGPROXY with the command NET START DBGPROXY, you don't need to do anything else. Visual Studio .NET automatically performs the magic for you, so you're simply debugging, and the detach options are available. Of course, if DBGPROXY does stop for some reason, all processes it was debugging are terminated. I'd highly recommend setting the DBGPROXY service to automatic start-up so that you can start benefiting from it!
Handling Dump Files
Back in Chapter 3 I discussed the SUPERASSERT dialog box and its Create Mini Dump button, which allows you to snap to disk the current state of the process so that you can load it up in the debugger later. Visual Studio .NET makes it easy to read any dump files you create. Opening a dump file in Visual Studio .NET is as simple as opening a regular solution.
After starting Visual Studio .NET, select Open Solution from the File menu. In the Open Solution dialog box, navigate to the directory where your dump file is stored. Dump files traditionally have the extension DMP, which is already in the Files Of Type combo box, so you can either choose it or enter *.DMP in the File Name edit control. Select your DMP file, and click the Open button. As always, Visual Studio .NET will create the ubiquitous solution file necessary to do anything in the environment. Press any of the debug keys—Step Into, Step, or Debug—to receive the prompt for saving the solution and to load the dump file.
If you're working on the machine where the dump file was created and your binaries were compiled, Visual Studio .NET will automagically find the source and symbols to match up with the dump file. To get the operating symbols lined up, either set the _NT_SYMBOL_PATH to include the symbol store for your location, or after starting debugging, open the Modules window, right-click on the modules without symbols, and browse over to the correct symbols.
To help the debugger specify where to find the modules, you've got two ways of telling the debugger where to look. The easiest way is to specify the module directories in the MODPATH environment variable. Simply add each directory separated by semicolons to the MODPATH environment variable as you would for the PATH environment variable. If you'd like to set the module look up path globally, you can specify them to the SZ_REG value GlobalModPath in either of the following two registry keys. Use the HKEY_LOCAL_MACHINE if you want the path available to all users on the machine.
HKEY_CURRENT_USER\Software\Microsoft\VisualStudio\7.1\NativeDE\Dumps\ HKEY_LOCAL_MACHINE\Software\Microsoft\VisualStudio\7.1\NativeDE\Dumps\
Unfortunately, the Visual Studio .NET debugger won't read binaries out of your symbol server directly, where WinDBG can. Therefore, if you're working with dump files from customer sites, you're probably better off using WinDBG, discussed in the next chapter, to handle those dump files.
In addition to opening dump files, Visual Studio .NET can also create them. At first that might not sound very exciting, but from a Bugslayer debugging standpoint, we now have another great technique for solving problems. By creating dump files at various stages during a hard-core debugging session, you instantly have a post mortem trail you can follow that leads up to the problem. This opens up excellent opportunities to grab program states to show others on the team as well as to verify behavior over time. I end up doing so many snapshots during hard debugging sessions that I can quickly fill up whole hard disks. However, hard disks are dirt cheap compared to the costs that can be incurred as a result of not fixing a bug.
Writing dump files is easy when you're in the middle of a debugging session. Select the Save Dump As menu option from the bottom of the Debug menu. That brings up a File Save dialog box in which you can specify exactly where the dump file should be created. Visual Studio .NET lets you write two types of dump files. Visual Studio .NET calls the first type simply minidump. This file contains the operating system version information, the stack walk of all threads, and the file version information of each module loaded in the process. The regular minidump files are quite small. I have a debugger attached to Word 2002 as I write this chapter and the minidump file is only 38 K when the working set is over 16 MB.
The second type of dump file you can write is a minidump with heap. This file writes out the same information as a minidump along with all allocated memory in the process. With this dump file format you can now follow pointer values through the entire address space. Of course, that extra information comes at a much bigger cost. The minidump with heap for Microsoft Word 2002 with this entire chapter loaded is 96 MB! In general, I mostly stick with the straight minidump version because I've rarely needed to wind through multiple pointer layers. However, it's nice to know it's there.
Unfortunately, Visual Studio .NET doesn't offer an option to write out the most useful dump format, the minidump with handles. The argument could be made that since Visual Studio .NET does not offer a means for viewing handle information, there's no need to write that information out. However, WinDBG does allow you to view handle information, as you'll see in the next chapter. Having the handle information is the difference between tracking down a multithreaded deadlock and not solving it. Since the handle information is so important, the SUPERASSERT dialog box does write it out.
Finally, make sure you read about WinDBG's dump file handling. Although WinDBG is harder to use, the debugger is better suited to reading the dump files you get from customers primarily because it can load the binaries out of your symbol store. With its better symbol handling and extra informational commands, you can determine the cause of those customer problems more easily.
One big problem with Visual Studio 6 was that trying to get breakpoints set in a DLL that was dynamically loaded in the Additional DLL dialog box was, to say it charitably, a disaster. Remote debugging was especially problematic. However, you might not have even noticed the change with Visual Studio .NET because Microsoft fixed the breakpoints so that they automatically rearm themselves when the module containing the source file comes into the address space. In the Breakpoint window, disarmed breakpoints have a white question mark in the red dot. The Additional DLL dialog box is gone, and good riddance!
|
EAN: 2147483647
Pages: 177