x86 Assembly Language
|
In many cases, when your native application crashes, the real difference between solving the bug and screaming in frustration comes down to how well you can read a little assembly language. Although we'd all prefer our crashes to occur in a module with source code and a complete call stack, many crashes just don't happen that way. When you do crash, you're generally left looking at the Disassembly window in the Visual Studio .NET debugger and wondering how you're going to figure out where you are in the program, let alone why you crashed.
By no means am I saying that you need to know assembly language well enough to write all your programs using Microsoft Macro Assembler (MASM). The key is to learn enough assembly language to be comfortable reading it. My goal for this section is to present the information you need to have a working knowledge of assembly language. By the time you finish reading this section and practice for a couple of hours, you'll know more than enough assembly language to get by. This small investment of time can be the difference between flailing around in the debugger practicing your primal scream therapy and fixing your bugs. For those of you who have done assembly language programming in the past, keep in mind that everything I'm going to discuss here is in relation to what you'll see in the Disassembly window. You might remember more concise ways of doing some of these operations, but the important issue is getting familiar with how Visual Studio .NET displays assembly language.
Developers are sometimes wary of learning assembly language because they think some sort of black magic is involved. There's really nothing mysterious about assembly language, though; a single assembly language instruction does one thing and one thing only. Once you see the pattern and understand how the CPU carries out instructions, you'll realize that assembly language is actually quite elegant. If you want to look at black magic, take a look at any program that uses STL heavily. Those magical STL inline expansions can result in a call to 30 or 40 different functions and make an incredible number of assumptions. To me, STL is sometimes far more mystifying than assembly language.
After introducing you to assembly language, I'll turn back to the Visual Studio .NET debugger and show you how to survive in the Disassembly window. For example, I'll show you how to look up parameters on the stack and navigate within the Disassembly window. I'll also explain the relationship between the Memory window and the Disassembly window as well as supply you with tips and tricks that will help you debug at the assembly-language level.
Before we jump into assembly language, I need to issue one warning. Some of you are really going to get into assembly language. That's great, but it can lead to a problem for your career. Your bosses have already spoken with me and have asked that you not start jumping into assembly language every chance you get. It's not portable and can make maintenance much harder.
The Basics of the CPU
The Intel instruction set has been around for quite a while and has its roots in the 8086 CPU that Intel first released in 1978. In the days of MS-DOS and 16-bit Microsoft Windows, assembly language used to be a little quirky and hard to use because of the way the CPU handled memory, which was through 64 KB blocks of memory called segments. Fortunately, today on Windows operating systems, the CPU has direct access to the entire address space, which means that assembly language is much easier to deal with.
The assembly language that I'll be introducing here will be the basic 32-bit instruction set that is compatible across all x86 architecture CPUs from both Intel and AMD and is also referred to as IA32. The advanced features on the Intel Pentiums, such as MMX, aren't generally an issue because Windows uses relatively few such features. I won't get into the real grungy parts of assembly-language instruction formats such as the ModR/M and SIB bytes, which both indicate ways to access memory. For the purposes of this chapter, memory access is memory access. I also won't be covering floating-point instructions. Operations on the Intel CPU floating-point unit (FPU) are similar to normal instructions. The main differences are that the FPU has its own set of registers and the floating-point instructions use a register stack– based architecture. If this chapter inspires you to learn more about the Intel family of CPUs—and I hope it does—you should download the three-volume Intel Architecture Software Developer's Manual Adobe PDF files from www.intel.com. The most important manual is Volume 2, the Instruction Set Reference. Volumes 1 and 3 are for basic CPU architecture information and operating systems developers, respectively. For the price of a phone call, you can even get the actual Intel CPU reference manuals from Intel free. Although you don't really need the actual manuals, they sure do make you look smart when they're sitting on your bookshelf!
One key point to remember is that the x86 CPUs are very flexible and provide you with many ways to carry out similar operations. Fortunately for us, the Microsoft compilers do a good job of picking the fastest way to do an operation and reusing that construct wherever applicable, so recognizing what a section of code is doing is easier. In the following sections, I'll cover the most commonly used instructions you'll see in assembly language. If you're interested in all the assembly-language instructions, you can consult the Intel manuals.
Registers
The first topic I want to cover is the registers. Because every bit of data that your application handles passes through the registers at one time or another, knowing the purpose of each register can help you recognize code gone awry. x86 CPUs have eight general-purpose registers (EAX, EBX, ECX, EDX, ESI, EDI, ESP, and EBP), six segment registers (CS, DS, ES, SS, FS, and GS), an instruction pointer (EIP), and a flags register (EFLAGS). The CPU has other registers as well, such as the debug and machine control registers, but they're special-purpose registers and you won't encounter them in normal user-mode debugging. Figure 7-9 shows the layout of a general-purpose register. The thing to remember is that some of the registers allow mnemonics to access different portions of the complete 32-bit register. The complete breakdown of all general-purpose registers is listed in Table 7-6. The only segment register of interest for this discussion is the FS register, which holds the thread information block (TIB) that describes the currently executing thread. The other segment registers are used, but the operating system configures them in such a way that they're transparent to normal operation. The instruction pointer holds the address of the currently executing instruction.
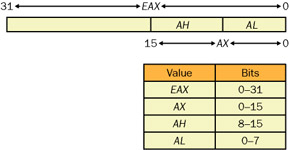
Figure 7-9: General.purpose register layout
The flags register, EFLAGS, contains the status flags and the control flags. Various instructions set bits in EFLAGS to indicate the result of those instructions. For example, the ZF (Zero Flag) bit is set to 1 when the result of an instruction is 0. In Chapter 4, I described setting the CPU to single-step mode, which involved setting the TF (Trap Flag) in the EFLAGS register. Figure 7-10 shows the Registers window from the Visual Studio .NET debugger. The Registers window displays the EFLAGS register as EFL. Notice that I'm not showing floating-point registers or any of the other special registers such as MMX or 3DNow! in the Registers window. You can choose the registers you want to see by right-clicking in the Registers window and selecting the registers you're interested in from the context menu.
| 32-Bit Register | 16-Bit Access | Low-Byte Access (Bits 0–7) | High-Byte Access (Bits 8–15) | Special Uses |
|---|---|---|---|---|
| EAX | AX | AL | AH | Integer function return values are stored here. |
| EBX | BX | BL | BH | |
| ECX | CX | CL | CH | Loop instruction counters use this register for counting. |
| EDX | DX | DL | DH | The high 32 bits of 64-bit values are stored here. |
| ESI | SI | In memory move or compare instructions, the source address is stored here. | ||
| EDI | DI | In memory move or compare instructions, the destination address is stored here. | ||
| ESP | SP | The stack pointer. This register is changed implicitly when calling functions, returning from functions, making room on the stack for local variables, and cleaning up the stack. | ||
| EBP | BP | Base/frame pointer. This register holds the stack frame for a procedure. |
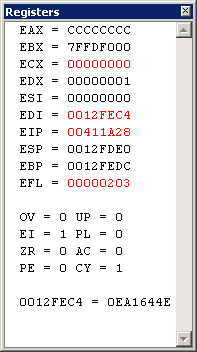
Figure 7-10: The Visual Studio .NET Registers window
Table 7-7 lists the flag values shown in the Registers window. The Visual Studio .NET documentation doesn't mention what the flag values in the Registers window mean, so you might never have seen these values before. Unfortunately, the mnemonics Visual Studio .NET uses for these flags don't correspond to the Intel mnemonics, so you'll have to translate when referring to the Intel documentation. However, one nice change to the Registers window with Visual Studio .NET is that the actual flag values change to red when they change. Previous editions of Visual Studio never highlighted the changed flag fields in any way, so it was very hard to determine what had changed. Fortunately, for essentially 100 percent of your native debugging, you'll never need to watch the flags.
| Registers Window Flag | Meaning | Intel Manual Mnemonic | Notes |
|---|---|---|---|
| OV | Overflow flag | OF | Set to 1 if the operation resulted in an integer overflow or underflow. |
| UP | Direction flag | DF | Set to 1 if string instructions are processed from highest address to lowest address (autodecrement). 0 means that string instructions are processed from lowest address to highest address (autoincrement), which is always the case in C/C++ code generation. |
| EI | Interrupt Enable flag | IF | Set to 1 if interrupts are enabled. This flag will always be 1 in a user-mode debugger because if interrupts are off, you won't be able to use the keyboard or see any screen updating. |
| PL | Sign flag | SF | Reflects the most significant bit of an instruction result. Set to 0 for positive values, 1 for negative values. |
| ZR | Zero flag | ZF | Set to 1 if the instruction result is 0. This flag is important for compare instructions. |
| AC | Auxiliary Carry flag | AF | Set to 1 if a binary-coded decimal (BCD) operation generated a carry or a borrow. |
| PE | Parity flag | PF | Set to 1 if the least significant byte of the result contains an even number of bits set to 1. |
| CY | Carry flag | CF | Set to 1 if an arithmetic operation generates a carry or a borrow out of the most significant bit of the result. Also set to 1 on an overflow condition for unsigned integer arithmetic. |
One important feature of the Registers window is that you can edit the values in it. Although the Registers window looks like a standard text window, such as the Output window, you can change the values in it. Simply put the cursor anywhere within the number to the right of the equal sign for the register you want to change, and type in your revision. The place you put your cursor within the value is where you'll start overtyping the current value. Undo is also supported in the Register window.
Instruction Format and Memory Addressing
The basic instruction format .for the Intel CPUs is follows. All instructions follow the same pattern.
[prefix] instruction [operands]
For the most part, you see prefixes only on some string functions. (I'll cover the common situations in which string functions use prefixes in the "String Manipulation" section later in the chapter.) The operands format, shown here, indicates the direction of the operation. The source goes into the destination, so read the operands from right to left.
Single-instruction operands : XXX source Two-instruction operands: XXX destination, source
In fact, the biggest trick to reading assembly language I can give you is to hold your index finger straight at the second (source) operand and make a little hop with your finger to the left until it's pointing at the destination operand. When you do the finger movement, say "source to destination" each time. That's exactly what I do when I read assembly language. The biggest mistake everyone makes with Intel assembly language is getting the source and destination backwards, so the little finger hop really helps. Some people have told me they help keep it straight by thinking of the comma between the source and destination as an equal sign. No matter what, the operation still feels backwards, unless, of course, you read Arabic or Hebrew.
The source operand can be a register, a memory reference, or an immediate value—that is, a hard-coded value. The destination operand can be a register or a memory reference. The Intel CPUs don't allow both a source and a destination to be memory references.
Memory references are those operands that appear within brackets. For example, the memory reference [0040129Ah] means "get the value at memory location 0x0040129A." The h is the assembly-language way of specifying a hexadecimal number. Using [0040129Ah] is the same as accessing a pointer to an integer in C with *pIVal. Memory references can be through registers, as in [EAX], which means "get the memory at the address in EAX." Another common memory reference specifies an address by adding an offset to a register value. [EAX+0Ch] means "add 0xC to the value in EAX and get that memory." Some memory references, such as [EAX+EBX*2], which indicates that the memory reference is from a calculation involving several registers, become fairly complicated.
To differentiate the sizes of memory references, you'll often see a memory reference preceded by a pointer size. The pointer sizes are shown as BYTE PTR, WORD PTR, and DWORD PTR for byte, word, and double-word references, respectively. You can think of these just as you think of a C++ cast. If the disassembly doesn't specify a pointer size, the size is a double word.
Sometimes an instruction's memory reference is straightforward and you can easily see the address for that memory. For example, a reference to [EBX] is just a reference to the memory held in the EBX register, so you can simply pull up the Memory window and type in EBX to look at it. Other times, however, it isn't possible to figure out the memory reference without performing some complicated hexadecimal multiplication. Fortunately, the Registers window will show you what memory the instruction is about to reference.
Notice the line 0012FEC4 = 0EA1644E at the bottom of Figure 7-10. That line is the effective address display. The current instruction, in this case at 0x00411A28, is referencing the address 0x0012FEC4, the left-hand side of the line. The right-hand side of the line is the value at the 0x0012FEC4 memory location, 0x0EA1644E. Only those instructions that access memory will show the effective address in the Registers window. Because x86 CPUs allow only one of the operands to be a memory reference, just keeping an eye on the effective address display can show you what memory you're about to access and what the value is at that memory location.
If the memory access isn't valid, the CPU generates either a General Protection Fault (GPF) or a page fault. A GPF indicates that you're trying to access memory that you don't have access to. A page fault indicates that you're trying to access a memory location that doesn't exist. If you're looking at a line of assembly-language code that crashes, the part to look at is the memory reference. That will tell you which values were invalid. For example, if the memory reference is [EAX], you need to look at the value in EAX. If EAX holds an invalid address, you need to start scanning backward in the assembly-language listing to see what instruction set EAX to the invalid value. Keep in mind that you might need to go back several calls to find the instruction. I'll show you how to walk the stack manually later in the chapter.
A Word About the Visual C++ .NET Inline Assembler
Before I jump into the assembly-language instructions, I want to talk for a bit about the inline assembler in Visual C++. Like most professional C++ compilers, the Visual C++ compiler allows you to embed assembly-language instructions directly in line with your C and C++ code. Although using inline assembly language isn't generally recommended because it restricts your code's portability, it's sometimes the only way to accomplish a task. In Chapter 15, I'll show you how to hook imported functions by using inline assembly language.
Earlier in this chapter, I said that you don't need to know how to write your programs in assembly language, and I'm not contradicting myself. Learning to use the inline assembler isn't the same as learning to write an entire program in MASM—your C/C++ program still provides the application infrastructure. You can think of the inline assembler as the programming equivalent of a Zoom feature. When you create a bitmap, for example, you start out by painting with broad strokes; when it comes time to put on the finishing touches, you zoom in so that you can control the individual pixels. In the same way, the inline assembler lets you "paint" your program in broad C/C++ strokes but allows you to zoom in when you need to control the individual assembly-language instructions. I want to show you how to use the inline assembler because just getting everyone to understand the odd MASM syntax for where directives are supposed to go would take about 100 pages, and inline assembly language is much easier to understand. Additionally, you can use the inline assembler to play around with the instructions I show you in this chapter so that you can see how they behave.
To show you the format for inline assembly language, I'll need to introduce your first instruction:
NOP No operation
NOP is the instruction that does nothing. The compiler sometimes uses NOP for padding inside functions to keep those functions aligned on proper memory reference boundaries.
The inline assembler keyword is __asm. After __asm, you enter the assembly-language instruction you want to execute. If you're not into carpal tunnel syndrome, to enter multiple instructions, you use __asm and enclose within braces as many assembly-language instructions as you'd like. The following two routines show you the format of inline assembly-language instructions. These routines are functionally equivalent.
void NOPFuncOne ( void ) { __asm NOP __asm NOP } void NOPFuncTwo ( void ) { __asm { NOP NOP } } Throughout the chapter, I'll use the inline assembler to illustrate assembly-language operations such as parameter and variable access. If you want to see how each instruction operates, open the ASMer program included with this book's sample files. This sample program contains all the assembly-language examples that follow.
Instructions You Need to Know
There are many different instructions on Intel CPUs; the Intel Instruction Set Reference chapter for the Pentium Xeon is 854 pages. That doesn't mean there are 854 instructions; it means that it takes 854 pages to describe what the instructions do. Fortunately, many of the instructions aren't used in user-mode programs, so you don't need to be concerned with them. I'll cover only the instructions that are frequently used by the Microsoft code generator and the situations in which you'll commonly need them. The format I'll use is to describe a couple of instructions and then demonstrate scenarios in which they apply. Additionally, all the actual assembly language will be displayed as you'd see it in the Visual Studio .NET Disassembly window. That way, you'll get used to the real-world assembly language you'll be reading.
Stack Manipulation
PUSH Push a word or a double word onto the stack
POP Pop a value from the stack
Intel CPUs use the stack extensively. Other CPUs, which have many more registers, might pass parameters to functions in the registers, but the Intel CPUs pass most parameters on the stack. The stack starts in high memory and grows downward. Both these instructions implicitly change the ESP register, which reflects the current top of the stack. After a PUSH, the value in the ESP register decreases. After a POP, ESP increases.
You can push registers, memory locations, or hard-coded numbers. Popping an item from the stack usually moves the item into a register. The key characteristic of the CPU stack is that it's a last in, first out (LIFO) data structure; if you push three registers to save their values, you must pop them off in reverse order, as shown here:
void PushPop ( void ) { __asm { // Save the values in EAX, ECX, and EDX. PUSH EAX PUSH ECX PUSH EDX // Do some operation here that might destroy the values in each // of those registers. // Restore the previously saved registers. Notice that they are // removed from the stack in LIFO order. POP EDX POP ECX POP EAX } } Even though there are far more efficient ways of exchanging values, the PUSH and POP instructions allow you to swap register values. The swap happens when you reverse the order of the POP instructions.
void SwapRegistersWithPushAndPop ( void ) { __asm { // Swap the EAX and EBX values using the stack. The sequence gives // you an idea of how to make this swap. PUSH EAX PUSH EBX POP EAX POP EBX } } PUSHAD Push all general-purpose registers
POPAD Pop all general-purpose registers
Occasionally when you're debugging through system code, you'll run into these two instructions. Instead of having long chains of PUSH instructions to save all general registers followed later by an equally long set of POP instructions to retrieve all general registers, the Intel CPU offers these two instructions to save and retrieve the registers for you.
Very Common Simple Instructions
MOV Move
The MOV instruction is the most common instruction used on the CPU because it's the way to move values from one place to another. I just showed you how to swap two registers by using only PUSH and POP; now I'll show you how to make the same swap with the MOV command.
void SwapRegisters ( void ) { __asm { // The EAX register is a temporary holder, so I put it on the // stack so I don't destroy its value. // Swap the ECX and EBX values. PUSH EAX MOV EAX , ECX MOV ECX , EBX MOV EBX , EAX POP EAX } } SUB Subtract
The SUB instruction is the subtract operation. It subtracts the source operand from the destination operand and stores the result in the destination operand.
void SubtractExample ( void ) { __asm { // Set the registers and do a subtraction. The formula for // this subtract example is EAX = Value(EAX) - Value(EBX). MOV EAX , 5 MOV EBX , 2 SUB EAX , EBX } } After running this code, EAX will contain a value of 3 and EBX will contain a value of 2.
ADD Add
The ADD instruction adds the source operand to the destination operand and stores the result in the destination operand.
INT 3 Breakpoint
INT 3 is the breakpoint instruction for Intel CPUs. Microsoft compilers use this instruction as padding between functions in a file. The padding keeps portable executable (PE) sections aligned based on the linker's /ALIGN switch, which defaults to 4 KB. The opcode, the hexadecimal number that corresponds to INT 3, is 0xCC, which is why it's used for padding as well as initializing stack variables with the / RTCs switch.
LEAVE High-level procedure exit
The LEAVE instruction restores the CPU state when leaving a function. I'll go into more detail about LEAVE in the following section.
Common Sequence: Function Entry and Exit
The majority of the functions in Windows and in your program set up and leave functions in the same manner. The setup is called the prolog, and the leaving is called the epilog; the compiler generates both automatically. When setting up the prolog, the code is setting up to access the function's local variables and parameters. The access is called a stack frame. Although the x86 CPU doesn't explicitly specify any stack frame scheme, the design of the CPU and some instructions make it easiest for operating systems to use the EBP register to hold the pointer to the stack frame.
__asm { // Standard prolog setup PUSH EBP // Save the stack frame register. MOV EBP , ESP // Set the local function stack frame to ESP. SUB ESP , 20h // Make room on the stack for 0x20 bytes of // local variables. The SUB instruction appears // only if the function has local variables. } This sequence is common in both debug and release builds. In some release build functions, however, you might see some instructions interspersed between PUSH and MOV. CPUs with multiple pipelines, such as those in the Pentium family, can decode multiple instructions at a time, so the optimizer will try to set up the instruction stream to take advantage of this capability.
Depending on the optimizations you chose when compiling your code, you can also have functions that don't use EBP as the frame pointer. Those procedures have what is called frame pointer omission (FPO) data. When you look at the disassembly for functions with FPO data, the code in the function looks as if it just starts manipulating data. You'll find out how to identify one of these functions in the next section.
The following common epilog undoes the operations of the prolog and is the one you'll see the most in debug builds. This epilog matches the preceding prolog.
__asm { // Standard epilog teardown MOV ESP , EBP // Restore the stack value. POP EBP // Restore the saved stack frame register. } In release builds, using the LEAVE instruction introduced earlier is faster than using the MOV/POP sequence, so you might see that the epilog will be just a LEAVE instruction. The LEAVE instruction is identical to the MOV/POP sequence. In debug builds, the compilers default to MOV/POP. Interestingly, the x86 CPU has a corresponding ENTER instruction to set up the prolog, but it's slower than the PUSH/MOV/ADD sequence, so the compilers don't use it.
How compilers choose to generate code depends a great deal on whether your program is optimized for speed or for size. If you optimize for size, as I strongly recommended in Chapter 2, many of your functions will use more standard stack frames. Optimizing for speed leads to the more convoluted FPO generation.
Pointer Manipulation
LEA Load effective address
LEA loads the destination register with the address of the source operand and is nearly always indicative of a local variable access. The following code snippet shows two examples of the LEA instruction. The first example shows how to assign an address to an integer pointer. The second shows how to retrieve the address of a local character array with the LEA instruction and pass the address as a parameter to the GetWindowsDirectory API function.
void LEAExamples ( void ) { int * pInt ; int iVal ; // The following instruction sequence is identical to the C code // pInt = &iVal ;. __asm { LEA EAX , iVal MOV [pInt] , EAX } //////////////////////////////////////////////////////////////////// char szBuff [ MAX_PATH ] ; // Another example of accessing a pointer through LEA. This // instruction sequence is identical to the C code // GetWindowsDirectory ( szBuff , MAX_PATH ) ;. __asm { PUSH 104h // Push MAX_PATH as the second parameter. LEA ECX , szBuff // Get the address of szBuff. PUSH ECX // Push the address of szBuff as the first // parameter. CALL DWORD PTR [GetWindowsDirectory] } }
Calling Procedures and Returning
CALL Call a procedure
RET Return from a procedure
Before I can start discussing where and how to access parameters and locals, I need to discuss how to call and return from functions. The CALL instruction is straightforward. When a CALL executes, the CALL implicitly pushes the return address on the stack, so if you stop at the first instruction of the called procedure and look at ESP, the address at the top of the stack is the return address.
The operand to the CALL instruction can be almost anything, and if you browse through the Disassembly window, you'll see calls that go through registers, memory references, parameters, and global offsets. You can use the effective address field of the Registers window to see the exact procedure you're about to call if the CALL is going through a pointer memory reference.
If you're calling a local function, your call will be a direct call to an address. However, many times you'll see calls that are through pointers, which are generally calls through your import address table (IAT) to imported functions or virtual function calls. If the symbols are loaded for the binary you're stepping through, you'll see something like the first CALL instruction shown in the CallSomeFunctions example that follows. This code indicates that you're calling through the IAT. The __imp__ is a dead giveaway. The CallSomeFunctions example also shows how to call a local function. In comments that follow the code, I note what the Disassembly window can show for the operation, depending on whether symbols are loaded.
void CallSomeFunctions ( void ) { __asm { // Call the imported function, GetLastError, which takes no // parameters. EAX will hold the return value. This is a // call through the IAT, so it is a call through a pointer. CALL DWORD PTR [GetLastError] // If symbols are loaded, the Disassembly window will show // CALL DWORD PTR [__imp__GetLastError@0 (00402000)]. // If symbols are not loaded, the Disassembly window will show // CALL DWORD PTR [00402000]. //////////////////////////////////////////////////////////////// // Call a function inside this file. CALL NOPFuncOne // If symbols are loaded, the Disassembly window will show // CALL NOPFuncOne (00401000). // If symbols are not loaded, the Disassembly window will show // CALL 00401000. } } The RET instruction returns to the caller by using the address that's at the top of the stack, with no checking whatsoever when the instruction is executed. Buffer overrun security exploitations attempt to replace the return address so that you'll return to code that implements the virus. As you can imagine, a corrupt stack can cause you to return anywhere in your application. The RET instruction is sometimes followed by a fixed number. This number specifies how many bytes to pop off the stack to account for parameters pushed on the stack and passed to the function.
Calling Conventions
In the discussion of CALL and RET, I briefly touched on parameters. In order to understand parameters, it's vital you understand calling conventions. The few instructions presented in the preceding section will help you do some excellent debugging. However, I need to tie procedure calling and calling conventions together so that I can start showing you how to decipher the Disassembly window.
A calling convention specifies how parameters are passed to a function and how stack cleanup occurs when the function returns. The programmer who codes a function dictates the calling convention that everyone must follow when calling that function. The CPU doesn't dictate any specific calling conventions. If you understand the calling conventions, you'll find it much easier to look up parameters in the Memory window and to determine the flow of the assembly language in the Disassembly window.
There are five calling conventions in all, but only three are common: the standard call (__stdcall), the C declaration (__cdecl), and the this call. Although you can specify the standard call and the C declaration yourself, the this call is automatically applied when you're using C++ code and dictates how the this pointer is passed. The other two calling conventions are the fast call (__fastcall) and the provocatively named naked calling convention. By default, Win32 operating systems don't use the fast-call calling convention in user-mode code because it isn't portable to other CPUs. The naked calling convention is used when you want to control the prolog and epilog generation yourself, as you'll see in Chapter 15.
Table 7-8 lists all the calling conventions. Recall from earlier in this chapter the description of the name decoration scheme for setting breakpoints on system functions. In Table 7-8, you'll see that the calling convention dictates the name decoration scheme.
| Calling Convention | Argument Passing | Stack Maintenance | Name Decoration | Notes |
|---|---|---|---|---|
| __cdecl | Right to left. | Caller removes arguments from the stack. This calling convention is the only one that allows variable argument lists. | Underscore prefixed to function names, as in _Foo. | The default for C and C++ functions. |
| __stdcall | Right to left. | Callee removes its own arguments from the stack. | Underscore prefixed to function name, and @ appended followed by the number of decimal bytes in the argument list, as in _Foo@12. | Used by almost all system functions; the default for Visual Basic internal functions. |
| __fastcall | First two DWORD parameters are passed in ECX and EDX; the rest are passed right to left. | Callee removes its own arguments from the stack. | An @ is prefixed to the name, and @ is appended followed by the number of decimal bytes in the argument list, as in @Foo@12. | Applies only to Intel CPUs. This calling convention is the default for Borland Delphi compilers. |
| this | Right to left. The this parameter is passed in the ECX register. | Caller removes arguments from the stack. | None. | Used automatically by C++ class methods unless you specify standard call. COM methods are declared as standard call. |
| naked | Right to left. | Caller removes arguments from the stack. | None. | Used when you need custom prolog and epilog. |
Changing the calling convention is done as part of the function declaration and definition. For example, the following shows where to place the calling convention. There are also compilation switches to CL.EXE that you can specify to change the default calling conventions for the compile, but I would recommend against using those switches and explicitly specify the calling convention on each function so there is no possible confusion for maintenance programmers.
// Declaring a __stdcall function: void __stdcall ImAStandardCallFunction ( void ) ;
If you've never been exposed to the different calling conventions, you might wonder why the different types exist. The differences between the C declaration and the standard call are subtle. In a standard call function, the callee cleans up the stack, so it has to know exactly how many parameters to expect. Therefore, a standard call function can't be a variable argument function such as printf. Because C declaration functions have the caller cleaning up the stack, variable argument functions are just fine. Additionally, standard call functions produce smaller code than C declaration functions. With C declaration, each time you make a call to a function, the compiler has to generate the code to clean up the stack. Since you can call that C declaration function from many places in your program, you'll have that stack cleanup after each call, thus bloating your program. Standard call functions, on the other hand, take care of their own cleanup inside the function itself, so the compiler doesn't have to generate any code after the call. Standard call is the default for Win32 system functions for precisely this reason. However, a great quiz question for someone who says they really know Win32 development is this: "What are the only two functions in Win32 that are not standard calls, and what calling convention do they use?" Although I'm tempted to not supply the answer and make you look it up, I'm also feeling benevolent: wsprintfA and wsprintfW.
Calling Conventions Example
To tie together the instructions I've shown so far and the calling conventions, Listing 7-3 shows an example of all the calling conventions from the Visual Studio .NET debugger's Disassembly window. The sample source code, ![]() CALLING.CPP, is included with this book's sample code if you want to take a look at it.
CALLING.CPP, is included with this book's sample code if you want to take a look at it.
Listing 7-3: Calling conventions example
1: /*---------------------------------------------------------------------- 2: "Debugging Applications in Microsoft .NET and Microsoft Windows" 3: Copyright (c) 1997-2003 John Robbins -- All rights reserved. 4: ----------------------------------------------------------------------*/ 5: #include "stdafx.h" 6: 7: // The strings passed to each function. 8: static char * g_szStdCall = "__stdcall" ; 9: static char * g_szCdeclCall = "__cdecl" ; 10: static char * g_szFastCall = "__fastcall" ; 11: static char * g_szNakedCall = "__naked" ; 12: 13: // The extern "C" turns off all C++ name decoration. 14: extern "C" 15: { 16: 17: // The __cdecl function. 18: void CDeclFunction ( char * szString , 19: unsigned long ulLong , 20: char chChar ) ; 21: 22: // The __stdcall function. 23: void __stdcall StdCallFunction ( char * szString , 24: unsigned long ulLong , 25: char chChar ) ; 26: // The __fastcall function. 27: void __fastcall FastCallFunction ( char * szString , 28: unsigned long ulLong , 29: char chChar ) ; 30: 31: // The naked function. The declspec goes on the definition, not the 32: // declaration. 33: int NakedCallFunction ( char * szString , 34: unsigned long ulLong , 35: char chChar ) ; 36: } 37: 38: void main ( void ) 39: { 00401000 push ebp 00401001 mov ebp,esp 40: // Call each function to generate the code. I separate each of them 41: // with a couple of NOP bytes to make it easier to read the 42: // disassembly. 43: __asm NOP __asm NOP 00401003 nop 00401004 nop 44: CDeclFunction ( g_szCdeclCall , 1 , 'a' ) ; 00401005 push 61h 00401007 push 1 00401009 mov eax,dword ptr [g_szCdeclCall (403028h)] 0040100E push eax 0040100F call CDeclFunction (401056h) 00401014 add esp,0Ch 45: __asm NOP __asm NOP 00401017 nop 00401018 nop 46: StdCallFunction ( g_szStdCall , 2 , 'b' ) ; 00401019 push 62h 0040101B push 2 0040101D mov ecx,dword ptr [g_szStdCall (40301Ch)] 00401023 push ecx 00401024 call StdCallFunction (40105Dh) 47: __asm NOP __asm NOP 00401029 nop 0040102A nop 48: FastCallFunction ( g_szFastCall , 3 , 'c' ) ; 0040102B push 63h 0040102D mov edx,3 00401032 mov ecx,dword ptr [g_szFastCall (403038h)] 00401038 call FastCallFunction (401066h) 49: __asm NOP __asm NOP 0040103D nop 0040103E nop 50: NakedCallFunction ( g_szNakedCall , 4 , 'd' ) ; 0040103F push 64h 00401041 push 4 00401043 mov edx,dword ptr [g_szNakedCall (403044h)] 00401049 push edx 0040104A call NakedCallFunction (40107Ah) 0040104F add esp,0Ch 51: __asm NOP __asm NOP 00401052 nop 00401053 nop 52: 53: } 00401054 pop ebp 00401055 ret 54: 55: void CDeclFunction ( char * szString , 56: unsigned long ulLong , 57: char chChar ) 58: { 00401056 push ebp 00401057 mov ebp,esp 59: __asm NOP __asm NOP 00401059 nop 0040105A nop 60: } 0040105B pop ebp 0040105C ret 61: 62: void __stdcall StdCallFunction ( char * szString , 63: unsigned long ulLong , 64: char chChar ) 65: { 0040105D push ebp 0040105E mov ebp,esp 66: __asm NOP __asm NOP 00401060 nop 00401061 nop 67: } 00401062 pop ebp 00401063 ret 0Ch 68: 69: void __fastcall FastCallFunction ( char * szString , 70: unsigned long ulLong , 71: char chChar ) 72: { 00401066 push ebp 00401067 mov ebp,esp 00401069 sub esp,8 0040106C mov dword ptr [ebp-8],edx 0040106F mov dword ptr [ebp-4],ecx 73: __asm NOP __asm NOP 00401072 nop 00401073 nop 74: } 00401074 mov esp,ebp 00401076 pop ebp 00401077 ret 4 75: 76: __declspec(naked) int NakedCallFunction ( char * szString , 77: unsigned long ulLong , 78: char chChar ) 79: { 80: __asm NOP __asm NOP 0040107A nop 0040107B nop 81: // Naked functions must EXPLICITLY do a return. 82: __asm RET 0040107C ret The code in Listing 7-3 is a debug build with all extra switches such as /RTCs and /GS removed to make the code easier to follow; also, the code doesn't actually do anything. I call each calling convention function in turn. Pay special attention to how the parameters are pushed to each function and to how the stack is cleaned up. I inserted NOP instructions between each of the functions to make the listing easier to read.
Variable Access: Global Variables, Parameters, and Local Variables
Now let's turn to accessing variables. Global variables are the easiest to access because they're just a memory reference with a fixed address. If you have symbols for the particular module at the address, you might get to see the name of the global variable. The following example shows how to access a global variable through the inline assembler. With the inline assembler, you can use your variables as either the source or the destination, depending on the instruction, just as you would in straight C programming.
int g_iVal = 0 ; void AccessGlobalMemory ( void ) { __asm { // Set the global variable to 48,059. MOV g_iVal , 0BBBBh // If symbols are loaded, the Disassembly window will show // MOV DWORD PTR [g_iVal (4030B4)],0BBBBh. // If symbols are not loaded, the Disassembly window will show // MOV DWORD PTR [4030B4],0BBBBh. } } If a function has standard stack frames, parameters are positive offsets from the EBP register. If you don't change EBP for the life of the function, parameters appear at the same positive offsets because you push the parameters on the stack before you call the procedure. The following code shows parameter access:
void AccessParameter ( int iParam ) { __asm { // Move the iParam value into EAX. MOV EAX , iParam // If symbols are loaded, the Disassembly window will show // MOV EAX,DWORD PTR [iParam]. // If symbols are not loaded, the Disassembly window will show // MOV EAX,DWORD PTR [EBP+8]. } } The second key phrase to remember after "source to destination" when moving your index finger from the second to the first operand while looking at assembly language is "Parameters are positive!" The fact that standard stack frames give you consistent offsets from EBP make it easy to figure out which parameter you're accessing in an instruction, because the first parameter will always be at [EBP+8], the second at [EBP+0Ch], the third at [EBP+10h], and so on. If you're into algebra formulas, the nth parameter can be calculated using the formula [EBP + (4 + (n 4))]. A little later in this chapter, after I discuss local variables, I'll show you an example using standard stack frames and describe exactly why these values are hard coded.
If you're debugging through optimized code and you see references that are positive offsets from the ESP stack register, you're looking at a function that has FPO data. Because ESP can change throughout the life of the function, you have to work a little harder to keep the parameters straight. When dealing with optimized code, you'll need to keep track of the items pushed onto the stack because a reference to [ESP+20h] can be the same reference as [ESP+8h] earlier in the function. In the process of debugging optimized code, I always take notes about where parameters are located when I'm single-stepping through the assembly language.
If the standard frames are used, local variables are negative offsets from EBP. The SUB instruction reserves the space, as shown in a preceding section "Common Sequence: Function Entry and Exit." The following code shows how to set a local variable to a new value:
void AccessLocalVariable ( void ) { int iLocal ; __asm { // Set the local variable to 23. MOV iLocal , 017h // If symbols are loaded, the Disassembly window will show // MOV DWORD PTR [iLocal],017h. // If symbols are not loaded, the Disassembly window will show // MOV [EBP-4],017h. } } If standard frames aren't used, finding local variables can be difficult—if you can find them at all. The problem is that local variables appear as positive offsets from ESP, just as parameters do. The trick in that case is to try to find the SUB instruction so that you can see how many bytes are devoted to local variables. If the ESP offset is larger than the number of bytes set aside for local variables, that offset reference is probably a parameter.
Stack frames are a bit confusing the first time you encounter them, so I think a final example and a couple of illustrations might help clarify the subject. The following code, a very simple C function, will show you why parameters are at positive offsets from EBP and why local variables are at negative offsets with standard stack frames. After the C function, AccessLocalsAndParamsExample, is the code to make the actual call and parameter setup. The last piece is the disassembly for the function as it was compiled in the ASMer sample program.
// The C function itself. void AccessLocalsAndParamsExample ( int * pParam1 , int * pParam2 ) { int iLocal1 = 3 ; int iLocal2 = 0x42 ; iLocal1 = *pParam1 ; iLocal2 = *pParam2 ; } // The code that calls AccessLocalsAndParamsExample void DoTheCall ( void ) { int iVal1 = 0xDEADBEEF ; int iVal2 = 0xBADDF00D ; __asm { LEA EAX , DWORD PTR [iVal2] PUSH EAX LEA EAX , DWORD PTR [iVal1] PUSH EAX CALL AccessLocalsAndParamsExample ADD ESP , 8 } } // The disassembly of AccessLocalsAndParamsExample void AccessLocalsAndParamsExample ( int * pParam1 , int * pParam2 ) { 0040107A push ebp 0040107B mov ebp,esp 0040107D sub esp,8 int iLocal1 = 3 ; 00401080 mov dword ptr [iLocal1],3 int iLocal2 = 0x42 ; 00401087 mov dword ptr [iLocal2],42h iLocal1 = *pParam1 ; 0040108E mov eax,dword ptr [pParam1] 00401091 mov ecx,dword ptr [eax] 00401093 mov dword ptr [iLocal1],ecx iLocal2 = *pParam2 ; 00401096 mov edx,dword ptr [pParam2] 00401099 mov eax,dword ptr [edx] 0040109B mov dword ptr [iLocal2],eax } 0040109E mov esp,ebp 004010A0 pop ebp 004010A1 ret If you set a breakpoint at the start of the AccessLocalsAndParamsExample function, address 0x0040107A, you'll see the stack and register values depicted in Figure 7-11.
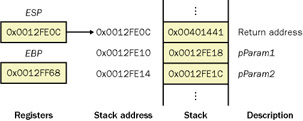
Figure 7-11: Stack before the AccessLocalsAndParamsExample function prolog
The first three assembly-language instructions in AccessLocalsAndParamsExample constitute the function prolog. The result of prolog execution is that the stack and the base pointer have been set up, the parameters are accessible through positive offsets from EBP, and the local variables are accessible through negative offsets from EBP. Figure 7-12 shows the stack and the base pointer values after each of the prolog instructions executes. I'd encourage you to walk through this example in both the text and in the ![]() ASMER.CPP program included with this book's sample code.
ASMER.CPP program included with this book's sample code.
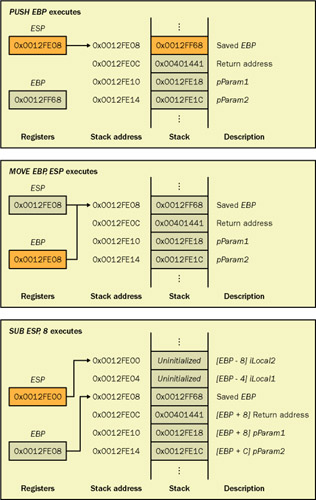
Figure 7-12: Stack during and after execution of the AccessLocalsAndParamsExample function prolog
More Instructions You Need to Know
The instructions covered in this section apply to data and pointer manipulation, comparing and testing, jumping and branching, looping, and string manipulation.
Data Manipulation
AND Logical-AND
OR Logical-OR (inclusive)
The AND and OR instructions perform the logical bitwise operations that should be familiar to everyone because they are the basis of bit manipulation.
NOT One's complement negation
NEG Two's complement negation
The NOT and NEG instructions sometimes cause some confusion because although they look similar, they certainly don't indicate the same operation. The NOT instruction is a bitwise operation that turns each binary 1 into a 0 and each 0 into a 1. The NEG instruction is the equivalent of subtracting the operand from 0. The following code snippet shows the differences between these two instructions:
void NOTExample ( void ) { __asm { MOV EAX , 0FFh MOV EBX , 1 NOT EAX // EAX now holds 0FFFFFF00h. NOT EBX // EBX now holds 0FFFFFFFEh. } } void NEGExample ( void ) { __asm { MOV EAX , 0FFh MOV EBX , 1 NEG EAX // EAX now holds 0FFFFFF01h ( 0 - 0FFh ). NEG EBX // EBX now holds 0FFFFFFFFh ( 0 - 1 ). } } XOR Logical-OR (exclusive)
You'll see the XOR instruction used quite a bit, not because people are keenly interested in exclusive OR operations but because it's the fastest way to zero out a value. Using XOR on two operands will set each bit to 1 if the same bit in each operand is different. If each bit is the same, the result is 0. Because XOR EAX, EAX is faster than MOV EAX, 0 (because the former takes fewer clock cycles), the Microsoft compilers use it to zero out registers.
INC Increment by 1
DEC Decrement by 1
These instructions are straightforward, and you can figure out what they do just from their names. The compiler often uses these instructions when optimizing certain code sequences because each of them executes in a single clock cycle. Additionally, these instructions map directly to the C integer ++ and the -- arithmetic operators.
SHL Shift left, multiply by 2
SHR Shift right, divide by 2
Binary manipulation bit shifts are faster than the corresponding multiplication and division instructions in x86 CPUs. These instructions are akin to the C << and >> bitwise operators, respectively.
DIV Unsigned division
MUL Unsigned multiplication
These seemingly straightforward instructions are in fact a little odd. Both instructions perform their unsigned operations on the EAX register. But the output implicitly uses the EDX register. The high bytes of double-word and higher size multiplications are placed in the EDX register. The DIV instruction stores the remainder in EDX and the quotient in EAX. Both instructions operate on the value in EAX only with register or memory values.
IDIV Signed division
IMUL Signed multiplication
These instructions are similar to the DIV and MUL instructions except that they treat operands as signed values. The same result gyrations happen with the IDIV and IMUL instructions as with the DIV and MUL instructions. An IMUL instruction sometimes has three operands. The first operand is the destination, and the last two are source operands. IMUL is the only three-operand instruction in the x86 instruction set.
LOCK Assert LOCK# signal prefix
LOCK isn't an actual instruction but rather a prefix to other instructions. The LOCK prefix tells the CPU that the memory accessed by the following instruction needs to be an atomic operation, so the CPU executing the instruction locks the memory bus and prevents any other CPUs on the system from accessing that memory. If you'd like to see the LOCK prefix in action, disassemble InterlockedIncrement in Windows XP or a later operating system version.
MOVSX Move with sign-extend
MOVZX Move with zero-extend
These two instructions copy smaller size values to larger size values and dictate how the larger values fill the upper bits. MOVSX indicates that the sign value on the source operand will extend through the upper bits of the destination register. MOVZX fills the upper bits of the destination register with 0. These are two instructions to watch for when you're tracking down sign errors.
Comparing and Testing
CMP Compare two operands
The CMP instruction compares the first and second operands by subtracting the second operand from the first operand, discarding the results, and setting the appropriate flags in the EFLAGS register. You can think of the CMP instruction as the conditional part of the C if statement. Table 7-9 shows the different flags and the values they correspond to when the CMP instruction executes.
| Result (First Operand Compared to Second Operand) | Register Window Flag Settings | Intel Manual Flag Settings |
|---|---|---|
| Equal | ZR = 1 | ZF = 1 |
| Less than | PL != OV | SF != OF |
| Greater than | ZR = 0 and PL = OV | ZF = 0 and SF = OF |
| Not equal | ZR = 0 | ZF = 0 |
| Greater than or equal | PL = OV | SF = OF |
| Less than or equal | ZR = 1 or PL != OV | ZF = 1 or SF != OF |
TEST Logical compare
The TEST instruction does a bitwise logical AND of the operands and sets the PL, ZR, and PE (SF, ZF, and PF for the Intel manuals) flags accordingly. The TEST instruction checks whether a bit value was set.
Jump and Branch Instructions
JMP Absolute jump
Just as the name implies, the JMP moves execution to the absolute address.
JE Jump if equal
JL Jump if less than
JG Jump if greater than
JNE Jump if not equal
JGE Jump if greater than or equal
JLE Jump if less than or equal
The CMP and TEST instructions aren't much good if you don't have a way to act on their results. The conditional jumps allow you to branch accordingly. These instructions are the most common ones you'll see in the Disassembly window, though there are 62 different conditional jumps in the Pentium Xeon II manual, many of which perform the same action except that the mnemonic is expressed with "not." For example, JLE (jump if less than or equal) has the same opcode as JNG (jump if not greater than). If you're using a disassembler other than the Visual Studio .NET debugger, you might see some of the other instructions. You should get the Intel manuals and look up the "Jcc" codes so that you can decode all the jump instructions.
I listed the conditional jump instructions in the same order they're shown in Table 7-9 so that you can match them up. One of the conditional jumps closely follows any CMP or TEST instructions. Optimized code might have a few instructions interspersed between the check and the jump, but those instructions are guaranteed not to change the flags.
When you're looking at a disassembly, you'll notice that the conditional check is generally the opposite of what you typed in. The first section in the following code shows an example.
void JumpExamples ( int i ) { // Here is the C code statement. Notice the conditional is "i > 0". // The compiler generates the opposite. The assembler that I show // is very similar to what the compiler generates. Different // optimization methods generate different code. // if ( i > 0 ) // { // printf ( "%i > 0\n" ) ; // } char szGreaterThan[] = "%i > 0\n" ; __asm { CMP i , 0 // Compare i to zero by subtracting (i -0). JLE JE_LessThanOne // If i is less than zero jump around to // the label. PUSH i // Push the parameter on the stack. LEA EAX , szGreaterThan // Push the format string. PUSH EAX CALL DWORD PTR [printf] // Call printf. Notice that you can // tell printf probably comes from a DLL // because I am calling through a pointer. ADD ESP , 8 // printf is __cdedcl so I need to clean up // the stack in the caller. JE_LessThanOne: // With the inline assembler, you can jump // to any C label. } //////////////////////////////////////////////////////////////////// // Take the absolute value of the parameter and check again. // The C code: // int y = abs ( i ) ; // if ( y >=5 ) // { // printf ( "abs(i) >= 5\n" ) ; // } // else // { // printf ( "abs(i) < 5\n" ) ; // } char szAbsGTEFive[] = "abs(i) >= 5\n" ; char szAbsLTFive[] = "abs(i) < 5\n" ; __asm { MOV EBX , i // Move i's value into EBX. CMP EBX , 0 // Compare EBX to zero (EBX -0). JG JE_PosNum // If result is greater than zero, EBX // is negative. NEG EBX // Turn negative into positive. JE_PosNum: CMP EBX , 5 // Compare EBX to 5. JL JE_LessThan5 // Jump if less than five. LEA EAX , szAbsGTEFive // Get the pointer to the correct string // into EAX. JMP JE_DoPrintf // Go to the printf call. JE_LessThan5: LEA EAX , szAbsLTFive // Get the correct pointer into EAX. JE_DoPrintf: PUSH EAX // Push the string. CALL DWORD PTR [printf] // Print it. ADD ESP , 4 // Restore the stack. } }
Looping
LOOP Loop according to ECX counter
You might not run into too many LOOP instructions because the Microsoft compilers don't generate them that much. In some parts of the operating system core, however (parts that look as if Microsoft wrote them in assembly language), you'll occasionally see them. Using the LOOP instruction is easy. Set ECX equal to the number of times to loop, and then execute a block of code. Immediately following the code is the LOOP instruction, which decrements ECX and then jumps to the top of the block if ECX isn't equal to 0. When ECX reaches 0, the LOOP instruction falls through.
Most of the loops you'll see are a combination of conditional jumps and absolute jumps. In many ways, these loops look like the if statement code presented a moment ago except that the bottom of the if block is a JMP instruction back to the top. The following example is representative of your average code-generation loop.
void LoopingExample ( int q ) { // Here's the C code: // for ( ; q < 10 ; q++ ) // { // printf ( "q = %d\n" , q ) ; // } char szFmt[] = "q = %d\n" ; __asm { JMP LE_CompareStep // First time through, check against // 10 immediately. LE_IncrementStep: INC q // Increment q. LE_CompareStep: CMP q , 0Ah // Compare q to 10. JGE LE_End // If q is >= 10, this function is done. MOV ECX , DWORD PTR [q] // Get the value of q into ECX. PUSH ECX // Get the value onto the stack. LEA ECX , szFmt // Get the format string. PUSH ECX // Push the format string onto the stack. CALL DWORD PTR [printf] // Print the current iteration. ADD ESP , 8 // Clean up the stack. JMP LE_IncrementStep // Increment q, and start again. LE_End: // The loop is done. } }
String Manipulation
The Intel CPUs are adept at manipulating strings. In the vernacular of CPUs, being good at string manipulation means that the CPU can manipulate large chunks of memory in a single instruction. All the string instructions I'll show you have several mnemonics, which you'll see if you look them up in the Intel reference manuals, but the Visual Studio .NET Disassembly window always disassembles string instructions into the forms I show. All these instructions can work on byte, word, and double-word size memory.
MOVS Move data from string to string
The MOVS instruction moves the memory address at ESI to the memory address at EDI. The MOVS instruction operates only on values that ESI and EDI point to. You can think of the MOVS instruction as the implementation of the C memcpy function. The Visual Studio .NET Disassembly window always shows the size of the operation with the size specifier, so you can tell at a glance how much memory is being moved. After the move is completed, the ESI and EDI registers are incremented or decremented depending on the Direction Flag in the EFLAGS register (shown as the UP field in the Visual Studio .NET Registers window). If the UP field is 0, the registers are incremented. If the UP field is 1, the registers are decremented. In all Microsoft compiler-generated code, the UP flag is always set to 1. The increment and decrement amounts depend on the size of the operation: 1 for bytes, 2 for words, and 4 for double words.
SCASS can string
The SCAS instruction compares the value at the memory address specified by the EDI register with the value in AL, AX, or EAX, depending on the requested size. The various flag values in EFLAGS are set to indicate the comparison values. The flag settings are the same as those shown in Table 7-9 on page 329. If you scan the string for a NULL terminator, the SCAS instruction can be used to duplicate the functionality of the C strlen function. Like the MOVS instruction, the SCAS instruction auto-increments or auto-decrements the EDI register.
STOS Store string
The STOS instruction stores the value in AL, AX, or EAX, depending on the requested size, into the address specified by the EDI register. The STOS instruction is similar to the C memset function. Like both the MOVS and SCAS instructions, the STOS instruction auto-increments or auto-decrements the EDI register.
CMPS Compare strings
The CMPS instruction compares two string values and sets the flags in EFLAGS accordingly. Whereas the SCAS instruction compares a string with a single value, the CMPS instruction walks the characters in two strings. The CMPS instruction is similar to the C memcmp function. Like the rest of the string manipulators, the CMPS instruction compares different size values and auto-increments and auto-decrements the pointers to both strings.
REP Repeat for ECX count
REPE Repeat while equal or ECX count isn't 0
REPNE Repeat while not equal or ECX count isn't 0
The string instructions, though convenient, aren't worth a great deal if they can manipulate only a single unit at a time. The repeat prefixes allow the string instructions to iterate for a set number of times (in ECX) or until the specified condition is met. If you use the Step Into key when a repeat instruction is executing in the Disassembly window, you'll stay on the same line because you're executing the same instruction. If you use the Step Over key, you'll step over the entire iteration. If you're looking for a problem, you might want to use the Step Into key to check the strings in ESI or EDI as appropriate. Another trick when looking at a crash in a repeat prefixed string instruction is to look at the ECX register to see which iteration crashed.
In talking about the string instructions, I mentioned which C run-time library function each was similar to. The following code shows, without obvious error checking, what the assembly-language equivalents could look like:
void MemCPY ( char * szSrc , char * szDest , int iLen ) { __asm { MOV ESI , szSrc // Set the source string. MOV EDI , szDest // Set the destination string. MOV ECX , iLen // Set the length to copy. // Copy away! REP MOVS BYTE PTR [EDI] , BYTE PTR [ESI] } } int StrLEN ( char * szSrc ) { int iReturn ; __asm { XOR EAX , EAX // Zero out EAX. MOV EDI , szSrc // Move the string to check into EDI. MOV ECX , 0FFFFFFFFh // The maximum number of characters to // check. REPNE SCAS BYTE PTR [EDI] // Compare until ECX=0 or found. CMP ECX , 0 // If ECX is 0, a JE StrLEN_NoNull // NULL wasn't found in the string. NOT ECX // ECX was counted down, so convert it // to a positive number. DEC ECX // Account for hitting the NULL. MOV EAX , ECX // Return the count. JMP StrLen_Done // Return. StrLEN_NoNull: MOV EAX , 0FFFFFFFFh // Because NULL wasn't found, return -1. StrLEN_Done: } __asm MOV iReturn , EAX ; return ( iReturn ) ; } void MemSET ( char * szDest , int iVal , int iLen ) { __asm { MOV EAX , iVal // EAX holds the fill value. MOV EDI , szDest // Move the string into EDI. MOV ECX , iLen // Move the count into ECX. REP STOS BYTE PTR [EDI] // Fill the memory. } } int MemCMP ( char * szMem1 , char * szMem2 , int iLen ) { int iReturn ; __asm { MOV ESI , szMem1 // ESI holds the first memory block. MOV EDI , szMem2 // EDI holds the second memory block. MOV ECX , iLen // The maximum bytes to compare // Compare the memory blocks. REPE CMPS BYTE PTR [ESI], BYTE PTR [EDI] JL MemCMP_LessThan // If szSrc < szDest JG MemCMP_GreaterThan // If szSrc > szDest // The memory blocks are equal. XOR EAX , EAX // Return 0. JMP MemCMP_Done MemCMP_LessThan: MOV EAX , 0FFFFFFFFh // Return -1. JMP MemCMP_Done MemCMP_GreaterThan: MOV EAX , 1 // Return 1. JMP MemCMP_Done MemCMP_Done: } __asm MOV iReturn , EAX return ( iReturn ) ; }
Common Assembly-Language Constructs
Up to this point, I've just been covering basic assembly-language instructions. Now I want to start looking at various assembly-language constructs that you'll encounter and explain how you identify them and translate them into higher-level operations.
FS Register Access
In Win32 operating systems, the FS register is special because the pointer to the thread information block (TIB) is stored in it. The TIB is also called the thread environment block (TEB). The TIB holds all the thread-specific data so that the operating system can keep your thread access straight. This thread-specific data includes all the structured exception handling (SEH) chains, thread local storage, the thread stack, and other information needed internally. For more information about SEH, see Chapter 13. For an example of thread local storage, see the MemStress discussion in Chapter 17.
The TIB is stored in a special memory segment, and when the operating system needs to access the TIB, it converts the FS register plus an offset into a normal linear address. When you see an instruction accessing the FS register, one of the following operations is underway: an SEH frame is being created or destroyed, the TIB is being accessed, or thread local storage is being accessed.
Creating or Destroying an SEH Frame The first instructions after setting up the stack frame are often something like the following code, which is standard code to start a __try block. The first node in the chain of SEH handlers is at offset 0 in the TIB. In the following disassembly, the compiler is pushing a data value and a pointer to a function on the stack. That function is __except_handler3 in Windows 2000 code. In Windows XP operating system code, the special function is _SEH_prolog. The first MOV instruction is accessing the TIB; the offset of 0 indicates that a node is being added to the top of the exception chain. The last two instructions indicate where the code moves the actual node to the chain.
PUSH 004060d0 PUSH 004014a0 MOV EAX , FS:[00000000] PUSH EAX MOV DWORD PTR FS:[0] , ESP
Although this example is nice and clean, the compiler doesn't always produce such tidy code. Sometimes it spreads the SEH frame creation throughout the code. Depending on the code generation and optimization flags, the compiler moves instructions around to take better advantage of the CPU's pipelining. The following disassembly example, in which KERNEL32.DLL symbols are loaded, shows the start of the Microsoft Windows 2000 IsBadReadPtr function:
PUSH EBP MOV EBP , ESP PUSH 0FFFFFFFFh PUSH 77E86F40h PUSH OFFSET __except_handler3 MOV EAX , DWORD PTR FS:[00000000h] PUSH EAX MOV DWORD PTR FS:[0] , ESP
What's interesting about Windows XP is that the operating system code seems to have custom exception handling that generates a call to _SEH_prolog, where most of the preceding code executes. That leads to much smaller code, and based on looking at the assembly language, it looks as if Windows XP functions that use SEH are using custom prolog and epilog to do their magic.
Destroying an SEH frame is much more mundane than creating one, as the following code shows. The key item to remember is that any access of FS:[0] means SEH.
MOV ECX , DWORD PTR [EBP-10h] MOV DWORD PTR FS:[0] , ECX
Accessing the TIB The value at FS:[18] is the linear address of the TIB structure. In the following code, the Windows XP implementation of GetCurrentThreadId gets the linear address of the TIB, and at offset 0x24, it gets the actual thread ID.
GetCurrentThreadId: MOV EAX , FS:[00000018h] MOV EAX , DWORD PTR [EAX+024h] RET
Accessing Thread Local Storage Thread local storage is a Win32 mechanism that allows you to have variables that are global, but each thread has its own instance of the global variables. Offset 0x2C in the TIB structure is the pointer to the thread local storage array. The following disassembly shows how to access the thread local storage pointer.
MOV ECX , DWORD PTR FS:[2Ch] MOV EDX , DWORD PTR [ECX+EAX*4]
Structure and Class References
Because so much of Windows development is structures and classes, I want to spend some time going over how you access that memory. Although structures and classes are convenient to deal with in high-level languages, at the assembly-language level they really don't exist. In high-level languages, a structure and a class are just shorthand ways to specify offsets into a blob of memory.
For the most part, the compilers lay out memory for your structures and classes just as you specify. Occasionally, the compiler will pad fields to keep them on natural memory boundaries, which for x86 CPUs is 4 or 8 bytes.
Structure and class references are denoted by a register and a memory offset. In the following MyStruct structure, the comments to the right of each member show the offset from the beginning of the structure for each member. After the MyStruct definition, I show various ways of accessing the structure fields.
typedef struct tag_MyStruct { DWORD dwFirst ; // 0-byte offset char szBuff[ 256 ] ; // 4-byte offset int iVal ; // 260-byte offset } MyStruct , * PMyStruct ; void FillStruct ( PMyStruct pSt ) { char szName[] = "Pam\n" ; __asm { MOV EAX , pSt // Place pSt into EAX. Below, I'm using the // direct offsets in the assembly language to show // what they look like in a disassembly. The // inline assembler allows you to use the normal // <struct>.<field> references. // C code : pSt->dwFirst = 23 ; MOV DWORD PTR [EAX] , 17h // C code: pSt->iVal = 0x33 ; MOV DWORD PTR [EAX + 0104h] , 0x33 // C code: strcpy ( pSt->szBuff , szName ) ; LEA ECX , szName // Push szName on the stack. PUSH ECX LEA ECX , [EAX + 4] // Get to the szBuff field. PUSH ECX CALL strcpy ADD ESP , 8 // strcpy is a __cdecl function. // C code: pSt->szBuff[ 1 ] = 'A' ; MOV BYTE PTR [EAX + 5] , 41h // C code: printf ( pSt->szBuff ) ; MOV EAX , pSt // Get pSt back. EAX was destroyed // on the call to strcpy. LEA ECX , [EAX + 4] PUSH ECX CALL DWORD PTR [printf] ADD ESP , 4 // printf is a __cdecl function. } }
A Complete Example
Now that I've covered all the important parts of Intel assembly language, I want to show a complete example of a Win32 API function before turning to the Disassembly window. Listing 7-4 shows the completely commented disassembly of the lstrcpyA function from the Windows 2000 Service Pack 2 KERNEL32.DLL. The lstrcpyA function copies one string into another string. I chose this function because it shows a little bit of everything that I've discussed so far in this chapter and because the purpose of the function is easily understood. I made the comments, delineated by semicolons, as detailed as possible.
Listing 7-4: lstrcpyA, a complete assembly language example
; Function prototype: ; LPTSTR __stdcall lstrcpy ( LPTSTR lpString1 , LPCTSTR lpString2 ) _lstrcpyA@8: ; Set up the standard stack frame prolog. PUSH EBP MOV EBP , ESP ; Take care of setting up the SEH __try block. The address 0x77E88000 ; points to -1. This is the default setup to indicate an __except block ; with EXCEPTION_EXECUTE_HANDLER. PUSH 0FFFFFFFFh PUSH 77E88000h PUSH OFFSET __except_handler3 (77E8615Bh) MOV EAX , DWORD PTR FS:[00000000h] PUSH EAX MOV DWORD PTR FS:[0] , ESP ; Instead of doing a "SUB ESP , 8" to reserve space for some more items ; on the stack related to SEH, the code generator chose to simply do ; two PUSH instructions. "PUSH ECX" is a single opcode (0x51) so this ; is the fastest way to go. PUSH ECX PUSH ECX ; Save off registers that may be stepped on by the function. EBX is not ; used. However, it might be pushed for pipelining purposes. PUSH EBX PUSH ESI PUSH EDI ; The last little bit of SEH setup to record where the try block starts ; on the stack and the code is entering the try block. MOV DWORD PTR [EBP-18h] , ESP AND DWORD PTR [EBP-4] , 0 ; The first step after setting up is to get the length of the string to ; copy. The string to copy is the second parameter. ; Move the second parameter, the string to be copied, into EDI. MOV EDI , DWORD PTR [EBP+0Ch] ; lstrcpy will look through 4,294,967,295 bytes for the NULL terminator. ; Remember that ECX is what REPNE SCAS uses to count the loop. OR ECX , 0FFFFFFFFH ; Zero out EAX to indicate what value to look for when scanning. XOR EAX , EAX ; Use the SCAS string instruction to rip through the string for NULL. REPNE SCAS BYTE PTR [EDI] ; Because ECX is counted down, switch all the bits so that the length of ; the string is in ECX. The length here includes the NULL character. NOT ECX ; Because the REPNE SCAS also incremented EDI, subtract the length of the ; string from EDI so that EDI points back to the start of the string. SUB EDI , ECX ; Hold the length of the string in EDX. EDX is not saved in this ; function as it is not required to be saved across C/C++ function ; calls. MOV EDX , ECX ; Move the second parameter into ESI since ESI is the source operand for ; the string instructions. MOV ESI , EDI ; Move the first parameter, the destination string, into EDI. MOV EDI , DWORD PTR [EBP+8] ; Save the second parameter into EAX. Again, EAX does not have to be ; saved across function calls. MOV EAX , EDI ; The string length was counted in bytes. Divide the string length by ; 4 to get the number of DWORDs. If the number of characters is odd, ; the REPE MOVS won't copy them all. Any remaining bytes are copied ; right after the REPE MOVS. SHR ECX , 2 ; Copy the second parameter string into the first parameter string. REP MOVS DWORD PTR [EDI] , DWORD PTR [ESI] ; Move the saved string length into ECX. MOV ECX , EDX ; AND the count with 3 to get the remaining bytes to copy. AND ECX , 3 ; Copy the remaining bytes from string to string. REP MOVS BYTE PTR [EDI] , BYTE PTR [ESI] ; Set the local variable to -1, which indicates that the function is ; leaving this try/except block. OR DWORD PTR [EBP-4] , 0FFFFFFFFh ; Get the previous SEH frame. MOV ECX , DWORD PTR [EBP-10h] ; Undo the SEH frame. MOV DWORD PTR FS:[0] , ECX ; Restore the registers saved earlier on the stack. POP EDI POP ESI POP EBX ; LEAVE does the same as the following instructions: ; MOV ESP , EBP ; POP EBP LEAVE ; Remove 8 bytes from the stack (the parameters) and return to the ; caller. ; lstrcpy is a __sdtcall function. RET 8
The Disassembly Window
Now that you've learned some assembly language, the Visual Studio .NET debugger Disassembly window shouldn't be so daunting. The Disassembly window offers many features that will help you with your debugging work. In this section, I'll talk about some of those features and how to minimize the time you spend in the Disassembly window.
Navigating
If you've ever worked with a debugger that didn't have navigation features that let you steer a course through disassembled code, you know that the lack of good navigation tools can lead to a very frustrating debugging experience. Fortunately, the Disassembly window offers several efficient ways to get where you need to go in the debuggee.
The first avenue for getting to a specific location in the debuggee is via the Address combo box at the top left corner of the Disassembly window. If you know the address you want to go to, simply type it in and jump right to it. The Address combo box can also interpret symbols and context information, so you can jump to areas even if you don't know the exact address.
The only small problem is that you're stuck with the symbol formatting issues I brought up in the "Advanced Breakpoint Syntax" section earlier in the chapter. You'll have to do the same translations to account for name decoration that you have to do when setting a breakpoint on a system or an exported function. For example, if you have symbols loaded for KERNEL32.DLL and you want to jump to LoadLibrary in the Disassembly window, you'll need to enter {,,kernel32}_LoadLibraryA@4 in the Address combo box to jump to the correct place.
One cool capability that the Disassembly window supports is drag and drop. If you're working through a section of assembly language and you need to quickly check where in memory an operation is going, you can select the address and drag it to the Address combo box. When you release the mouse button, the Disassembly window automatically jumps to that address.
As you're frolicking around the Disassembly window with abandon, don't be surprised if you realize that you've forgotten where you started—it's easy to get lost in the Disassembly window. To get back to where the instruction pointer is sitting, just right-click in the Disassembly window and select Show Next Statement. The Show Next Statement command is also available in source code windows. A great improvement over previous versions of Visual Studio is that the combo box will also keep track of all the places you've jumped to so that you can work your way back through a heavy round of jumping.
Viewing Parameters on the Stack
In the "Advanced Breakpoint Syntax" section earlier in this chapter, you saw how to set breakpoints on system and exported functions. One of the main reasons for setting breakpoints on these functions is so that you can view the parameters that go into a given function. To demonstrate how to look up items on the stack, I want to use a real-world example instead of a contrived, simple example.
When you download a program from the Internet, you want to make sure it's not starting up other programs behind the scenes. To double-check what it might be spawning off, you need to watch any calls to CreateProcess. I'll be using CMD.EXE for this example. Substitute the name of the program you want to monitor.
First, I used the DUMPBIN.EXE program that comes with Visual Studio .NET with the /IMPORTS command line option to determine what exactly CMD.EXE is calling. The output shows each DLL implicitly imported and what functions are called. Looking at the imported functions, you'll see that CMD.EXE imports CreateProcessW from KERNEL32.DLL. Then, from the Visual Studio .NET environment, I opened CMD.EXE as a new solution by selecting Open Solution from the File menu. (CMD.EXE is located in the %SYSTEMROOT%\System32 directory). Because I have symbols loaded, just as you will after reading this book, I needed to set a breakpoint on {,,kernel32}_CreateProcessW@40. After starting CMD.EXE, I typed in SOL.EXE on the command line and pressed Enter.
On Windows 2000 Service Pack 2, the breakpoint on _CreateProcessW@40 stops at 0x77E96F60 when the instruction about to be executed is PUSH EBP to set up the standard stack frame. Because the breakpoint is on the first instruction of CreateProcess, the top of the stack contains the parameters and the return address. I opened one of the Memory windows by selecting the Debug menu\Windows popup\Memory popup and then selecting one of the four Memory windows. After opening the Memory window, I right-clicked and selected 4-byte Integer from the context menu, and resized the window so that I had a vertical line of stack addresses and a single value next to each. Finally, I entered ESP, which is the stack pointer register, in the Address field to see what was on the stack.
Figure 7-13 shows the stack in the debugger Memory window at the start of the CreateProcess breakpoint. The first value displayed, 0x 4AD0728C, is the return address for the instruction; the next 10 are the parameters to CreateProcess. (See Table 7-10.) CreateProcess has 40 bytes of parameters; each parameter is 4 bytes long. The stack grows from high memory to low memory, and the parameters are pushed in right-to-left order, so the parameters appear in the Memory window in the same order as in the function definition.
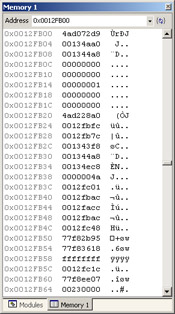
Figure 7-13: The stack displayed in the Visual Studio .NET debugger Memory window
| Value | Type | Parameter |
|---|---|---|
| 0x00134AA0 | LPCWSTR | lpApplicationName |
| 0x001344A8 | LPWSTR | lpCommandLine |
| 0x00000000 | LPSECURITY_ATTRIBUTES | lpProcessAttributes |
| 0x00000000 | LPSECURITY_ATTRIBUTES | lpThreadAttributes |
| 0x00000001 | BOOL | bInheritHandles |
| 0x00000000 | DWORD | dwCreationFlags |
| 0x00000000 | LPVOID | lpEnvironment |
| 0x 4AD228A0 | LPCWSTR | lpCurrentDirectory |
| 0x0012FBFC | LPSTARTUPINFO | lpStartupInfo |
| 0x0012FB7C | LPPROCESS_INFORMATION | lpProcessInformation |
You can view the individual parameter values for the first two parameters in two ways. The first way is to open a second Memory window and put the address of the parameter into the Address field. Right-click in the window to select any data format you want from the upper portion of context menu. The more important options are toward the bottom of the context menu, where you can select to display the values at the memory address as ANSI or Unicode text. The second and easier way is to drag the address you want to view to the Watch window. In the Watch window, use a cast operator to view the address. For example, to view the lpApplicationName parameter in the example, you'd put (wchar_t*)0x00134aa0 in the Watch window.
It was easy to get the function parameters in the previous example because I stopped the function on the first instruction before the function had a chance to push additional items. If you need to check the parameters when you're in the middle of a function, you have to do a little more work. Finding the positive offsets from EBP helps. Sometimes the best technique is just to open the Memory window and start looking.
The Set Next Statement Command
Like source windows, the Disassembly window has a Set Next Statement command available from the right-click menu, so you can change EIP to another location to execute. You can get away with being a little sloppy when using the Set Next Statement line in a source view while debugging a Debug build, but you must be very careful with the Set Next Statement command in the Disassembly window.
The key to getting EIP set right—so that you don't crash—is to pay attention to the stack. Stack pops should balance out stack pushes; if they don't, you'll eventually crash your program. I don't mean to scare you off from changing execution on the fly; in fact, I encourage you to experiment with it. Changing execution with Set Next Statement is a powerful technique and can greatly speed up your debugging. If you take care of the stack, the stack will take care of you.
For example, if you want to reexecute a function without crashing immediately, make sure to change the execution so that the stack stays balanced. In this example, I want to execute the call to the function at 0x00401005 twice:
00401032 PUSH EBP 00401033 MOV EBP , ESP 00401035 PUSH 404410h 0040103A CALL 00401005h 0040103F ADD ESP , 4 00401042 POP EBP 00401043 RET
As I step through the disassembly twice, I need to make sure that I let the ADD instruction at address 0x0040103F execute to keep the stack balanced. As the discussion of the different calling conventions earlier in the chapter indicated, the assembly-language snippet shows a call to a __cdecl function because of the ADD instruction right after the call. To reexecute the function, I'd set the instruction pointer to 0x00401035 to ensure that the PUSH occurs properly.
Walking the Stack Manually
The Memory windows and the Disassembly window have a symbiotic relationship. As you're trying to determine what a sequence of assembly-language operations is doing in the Disassembly window, you need to have a Memory window open so that you can look at the addresses and values being manipulated. Assembly-language instructions work on memory, and memory affects the execution of assembly language; the Disassembly window and the Memory window together allow you to observe the dynamics of this relationship.
On its own, the Memory window is just a sea of numbers, especially when you crash. By combining the two windows, however, you can start figuring out some nasty crash problems. Using these windows together is especially important when you're trying to debug optimized code and the debugger can't walk the stack as easily. To solve the problem creating the crash, you have to walk the stack manually.
The first step in figuring out how to walk the stack is to know where your binaries are loaded into memory. The new Modules window makes finding out which modules are loaded where in your address space a complete piece of cake because it shows you the module name, the path to the module, the load order, and most important, the address range in which the module was loaded. By comparing items on the stack with the list of address ranges, you can get an idea of which items are addresses in your modules.
After you look at the load address ranges, you need to open both the Memory and Disassembly windows. In the Memory window, enter ESP, the stack register, into the Address field and show the values in double-word format by right-clicking within the window and selecting 4-byte Integer. Additionally, it works best if you pull the Memory window out of the docked position in the IDE and shrink it down so that you see only the stack addresses and a single row of 32-bit values. This view shows the stack analogous to how you think of the stack. When you see a number that looks as if it belongs to one of your loaded modules, select the entire number and drag it to the Address combo box in the Disassembly window. The Disassembly window will show the assembly language at that address, and if you built your application with full debugging information, you should be able to see what the caller function was.
If the ESP register dump doesn't show anything that looks like a module address, you can also dump the EBP register in the Memory window and do the same sorts of lookups. As you get more comfortable with assembly language, you'll start looking at the disassembly around the address that crashed. Studying the crash crime scene should give you some hints about where the return address might be located, either in ESP or in EBP.
The downside to looking up items on the stack manually is that you might have to hunt a considerable way down the stack before you start finding addresses that make sense. If you have an idea of where the modules loaded, however, you should be able to pick out the appropriate addresses quickly.
The Battle
A team called me in to help them debug an extremely nasty crash—one severe enough to prevent them from releasing the product. The team had spent nearly a month trying to duplicate the crash and still had no idea what was causing it. The only clue they had was that the crash happened only after they brought up the Print dialog box and changed some settings. After they closed the Print dialog box, the crash occurred a little later in a third-party control. The crash call stack indicated that the crash happened in the middle of GlobalUnlock.
The Outcome
At first I wasn't sure that anyone was still using the handle-based memory functions (GlobalAlloc, GlobalLock, GlobalFree, and GlobalUnlock) in Win32 programming. After looking at a disassembly of the third-party control, however, I saw that the control writer obviously ported the control from a 16-bit code base. My first hypothesis was that the control wasn't properly dealing with the handle-based memory API functions.
To test my hypothesis, I set some breakpoints on GlobalAlloc, GlobalLock, and GlobalUnlock so that I could find the places in the third-party control where memory was being allocated or manipulated. Once I got the breakpoints set in the third-party control, I started watching how the control used the handle-based memory. Everything seemed normal until I started working through the steps to duplicate the crash.
At some point after closing the Print dialog box, I noticed that GlobalAlloc was starting to return handle values that ended in odd values, such as 5. Because the handle-based memory in Win32 just needs a pointer dereference to turn the handle into a memory value, I immediately saw that I was on to a critical problem. Every memory allocation in Win32 must end in 0, 4, 8, or a C hex digit, because all pointers must be double-word aligned. The handle values coming out of GlobalAlloc were evidence that something serious was corrupted.
Armed with this information, the product manager was ready to jump on the phone and demand the source code for the third-party control because he was sure that the control was causing the crash and holding up his release. After calming him down, I told him that what we had found didn't prove anything and that I needed to be absolutely sure the control was the culprit before we made life miserable for the vendor. I continued to look at the control's memory usage and spent the next several hours chasing down all the handle-based memory manipulations in the control. The control was properly using the handle-based memory, and my new hypothesis became that the team's application contained the real problem. The crash in the third-party control was just a coincidence.
After looking through the team's code, I was more confused than ever because the application was a complete Win32 application and did nothing with handle-based memory. I then turned to their printing code and started looking at it. The code looked fine.
I went back and started to narrow down the cases that would duplicate the crash. After a few runs, I found that all I needed to do to crash was to bring up the Print dialog box and change the paper orientation. After closing the Print dialog box, I just needed to reopen it, and the crash would happen shortly after I closed it the second time. I was happy to get the problem duplicated to this minute level because the page orientation was probably just changing a byte somewhere in memory and causing the problem.
Although the code looked fine on the initial read, I went back through each line and double-checked it against the MSDN documentation. After 10 minutes, I found the bug. The team was saving the PRINTDLG data structure used to initialize the Print dialog box with the PrintDlg API function. The third field in the PRINTDLG structure, hDevMode, is a handle-based memory value that the Print dialog box allocates for you. The bug was that the team was using that memory value as a regular pointer and not properly dereferencing the handle or calling GlobalLock on the handle. When they changed values in the DEVMODE structure, they were actually writing to the global handle table for the process. The global handle table is a chunk of memory in which all handle-based heap allocations are stored. By having the wild writes to the global handle table, a call to GlobalAlloc would use invalid offsets and values calculated from the global handle table so that GlobalAlloc was returning pointers that were incorrect.
The Lesson
The first lesson is to read the documentation carefully. If the documentation says that the data structure is a "movable global memory object," the memory is handle-based memory and you need to dereference that memory handle properly or use GlobalLock on it. Even though 16-bit Microsoft Windows 3.1 seems like ancient history, some 16-bit-isms are still in the Win32 API, and you must pay attention to them.
Another lesson I learned was that the global handle table is stored in writable memory. I would have thought that such an important operating system structure would have been in read-only memory. After pondering the reasons Microsoft wouldn't protect that memory, I can only hazard a guess about why they didn't choose to make the global handle table read-only. Technically, the handle-based memory is just for backward compatibility, and Win32 applications should be using the Win32-specific memory types. Protecting the global handle table would require two context switches, from user mode to kernel mode, on each handle-based memory function call. Because those context switches are very expensive in processing time, I can see why Microsoft didn't protect the global handle table.
The final lesson I learned was that I spent too much time concentrating on the third-party control. In all, it took me around seven hours to find the bug. However, the fact that the bug could be duplicated only by bringing up the Print dialog box, which went through the team's code, should have tipped me off that the problem was closer to home.
Tips and Tricks
Earlier in the chapter, I presented some tips and tricks that can make your native debugging life easier. I want to finish up with a few tips that will help you when debugging assembly language.
Endians
The endianness of a CPU refers to which end of a byte is stored first. Intel CPUs are Little Endian, which means that the little end of a multibyte value is stored first. For example, the value 0x1234 is stored in memory as 0x34 0x12. It's important that you keep the Little Endian storage in mind when you're looking at memory in the debugger. You'll need to convert it in your head so that you're interpreting the correct values. If you use the Memory window to look at one of your link list nodes and the next pointer value is 0x12345678, the value will be displayed in byte format as 0x78 0x56 0x34 0x12.
If you're curious, the term Endian comes from Jonathan Swift's Gulliver's Travels, and the computer meaning came from a 1980 Request for Comments (RFC) concerning byte ordering by Danny Cohen. Danny's paper is at http:// www.rdrop.com/~cary/html/endian_faq.html#danny_cohen for those who want to know the entire story.
Garbage Code
As a crash dumps you into the Disassembly window, you have to determine whether or not you're looking at real code, which is sometimes a difficult task. Here are some tips that will help you figure out whether you're looking at something other than executable code.
-
I've found that turning on Code Bytes from the Disassembly window's right-click menu to see the opcodes for the instructions is useful. As you'll see in the following tips, knowing what opcode patterns to look for can help you decide whether you're looking at legitimate code.
-
If you're looking at a series of identical ADD BYTE PTR [EAX], AL instructions, you're not looking at valid assembly-language code. You're looking at a series of zeros.
-
If you see symbols but the offsets added to the symbols are very large numbers, generally over 0x1000, you're probably outside a code section. However, very large numbers can also mean that you're debugging a module that doesn't have private symbols available.
-
If you're looking at a bunch of instructions that I didn't cover in this chapter, you're probably looking at data.
-
If the Visual Studio .NET disassembler can't disassemble an instruction, it displays "???" as the opcode.
-
If the instruction isn't valid, the disassembler will display "db" followed by a number. The "db" stands for data byte and isn't a valid instruction. It means the opcode(s) at that location don't match a valid instruction according to the Intel opcode maps.
Registers and the Watch Window
The Visual Studio .NET debugger Watch window knows how to decode all the registers to values. Therefore, you can put a register in the Watch window and cast it to the type you want to observe. For example, if you're looking at a string manipulation instruction, you can enter (char*)@EDI or (wchar_t*)@EDI in the Watch window to view the data in a format that's easier to read.
Learn from ASM Files
If you'd like to see more mixed assembly-language and source code, you can have Visual Studio .NET generate the assembly listings for your source files. In the project Property Pages dialog box\C/C++ folder\Output Files property page\Assembler Output field, select Assembly With Source Code (/FAs) to make the compiler generate an ASM file for each of your source code files. You might not want to generate the ASM files for every build, but they can be instructive, letting you see what the compiler is generating. The ASM files don't require you to fire up your application every time you're curious about assembly language.
The files generated are nearly ready to compile with the Microsoft Macro Assembler (MASM), so they can be a challenge to read. Much of the files consist of MASM directives, but the main parts of the files show your C code with the assembly-language code below each construct. After reading this chapter, you shouldn't have any trouble following the flow of ASM files.
|
EAN: 2147483647
Pages: 177